Azimuthal integration#
Polar map#
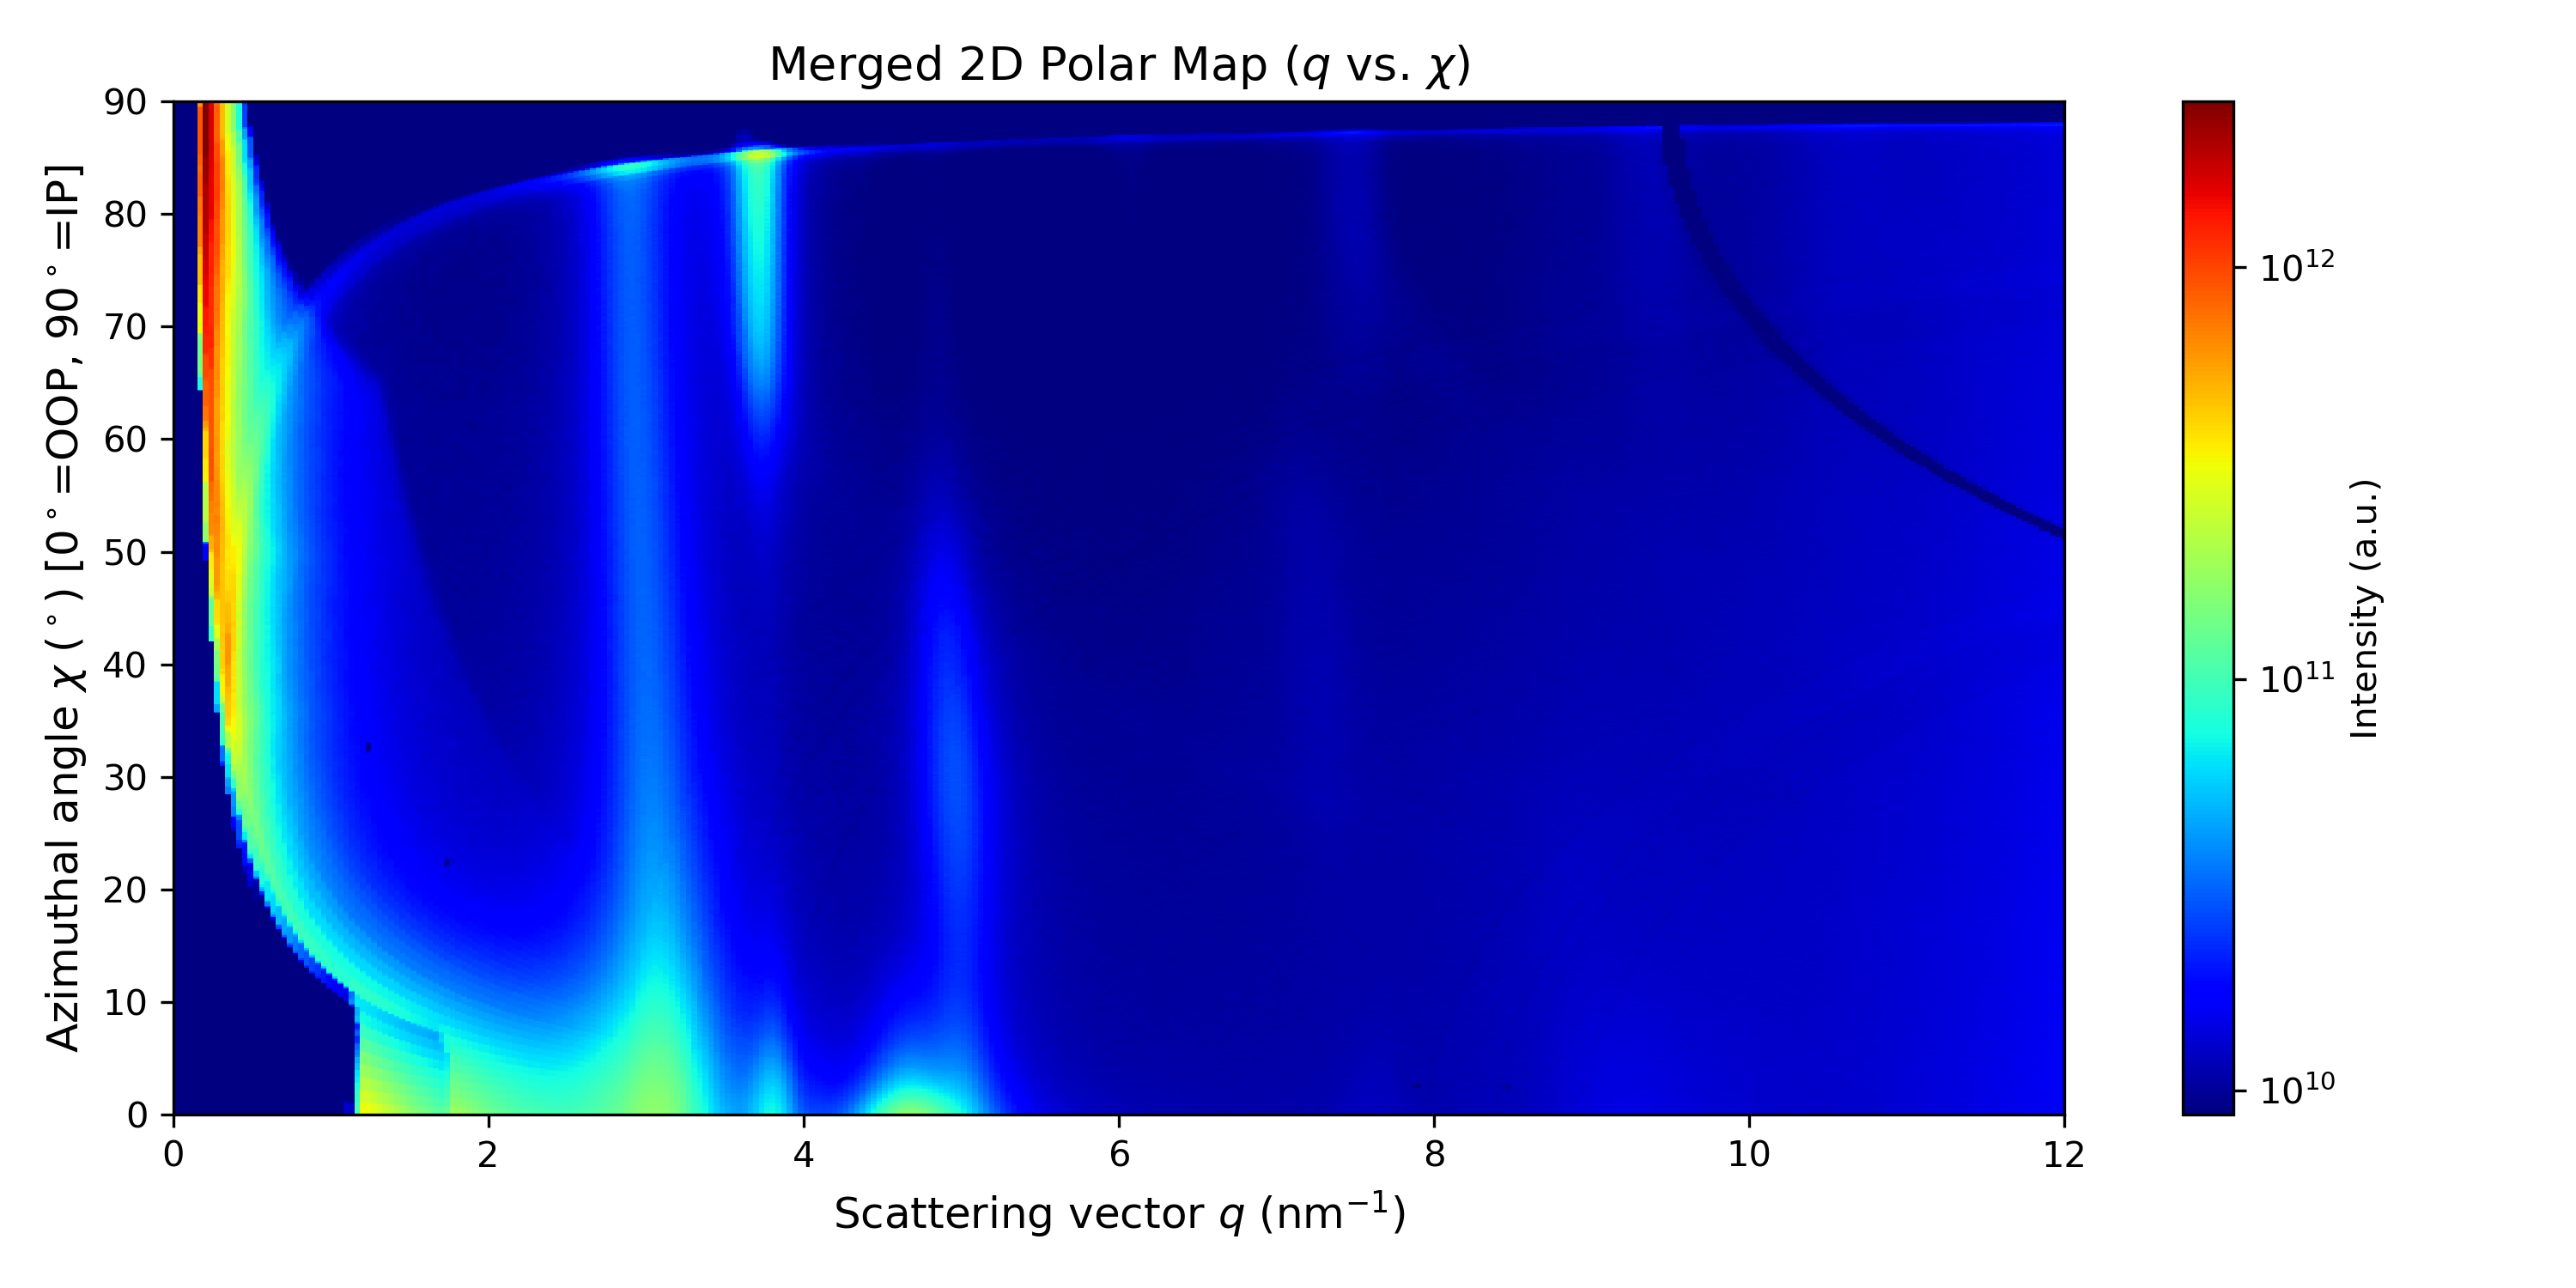
In this step, we will extract the azimuthal integration, which is useful for analyzing texturing effects. First, we generate the polar map (\(q\) vs \(\chi\) map), where we will define the integration region for the scan.
You can adjust the maximum \(q\) value to be displayed in the image, then run the cell.
# ==================== User Parameters ====================
# Directly adjust the maximum limit in q
max_q = 12  # Maximum q in nm^-1

# =========================================================
...
Running the cell will generate the map.
Azimuthal profile#
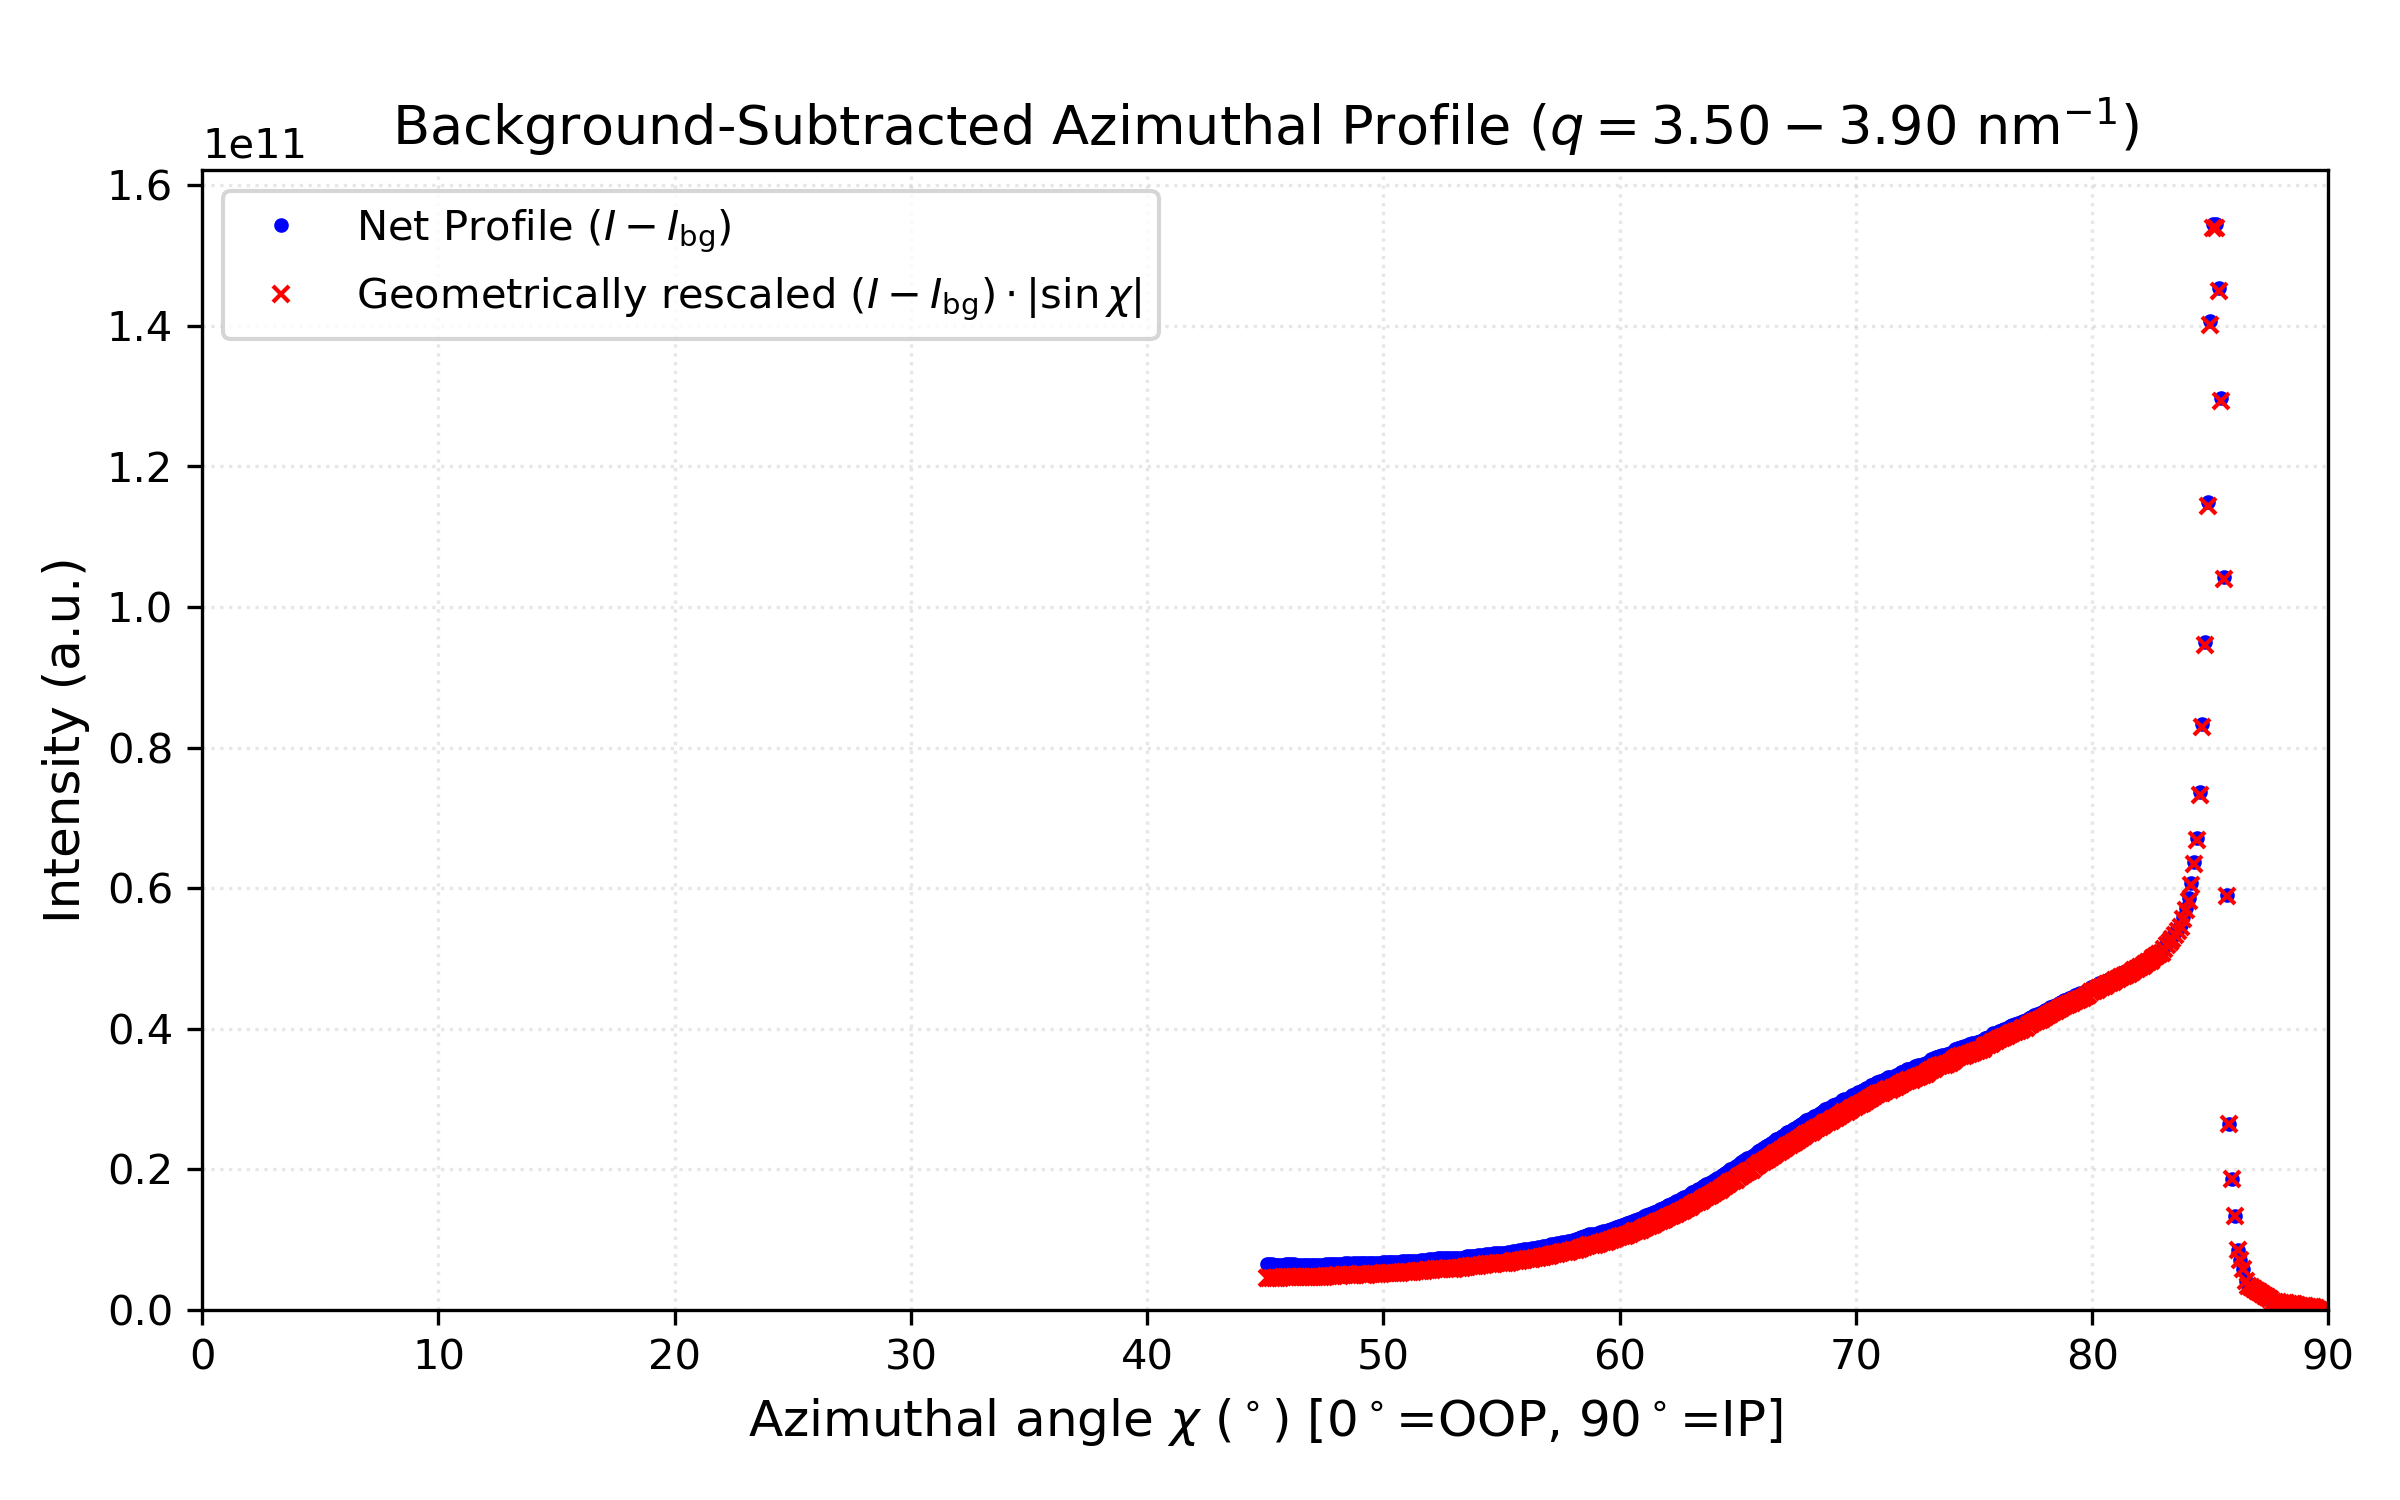
Now, we need to define the integration region on the 2D map to obtain the intensity vs. azimuthal angle (\(\chi\)) plot.
The scaling factor \(I(\chi) \cdot \vert{}\sin\chi\vert{}\) accounts for the geometrical solid angle element (\(d\Omega = \sin\chi \, d\chi \, d\phi\)) in textured thin films, which is essential for calculating orientation distribution functions (see [18]).
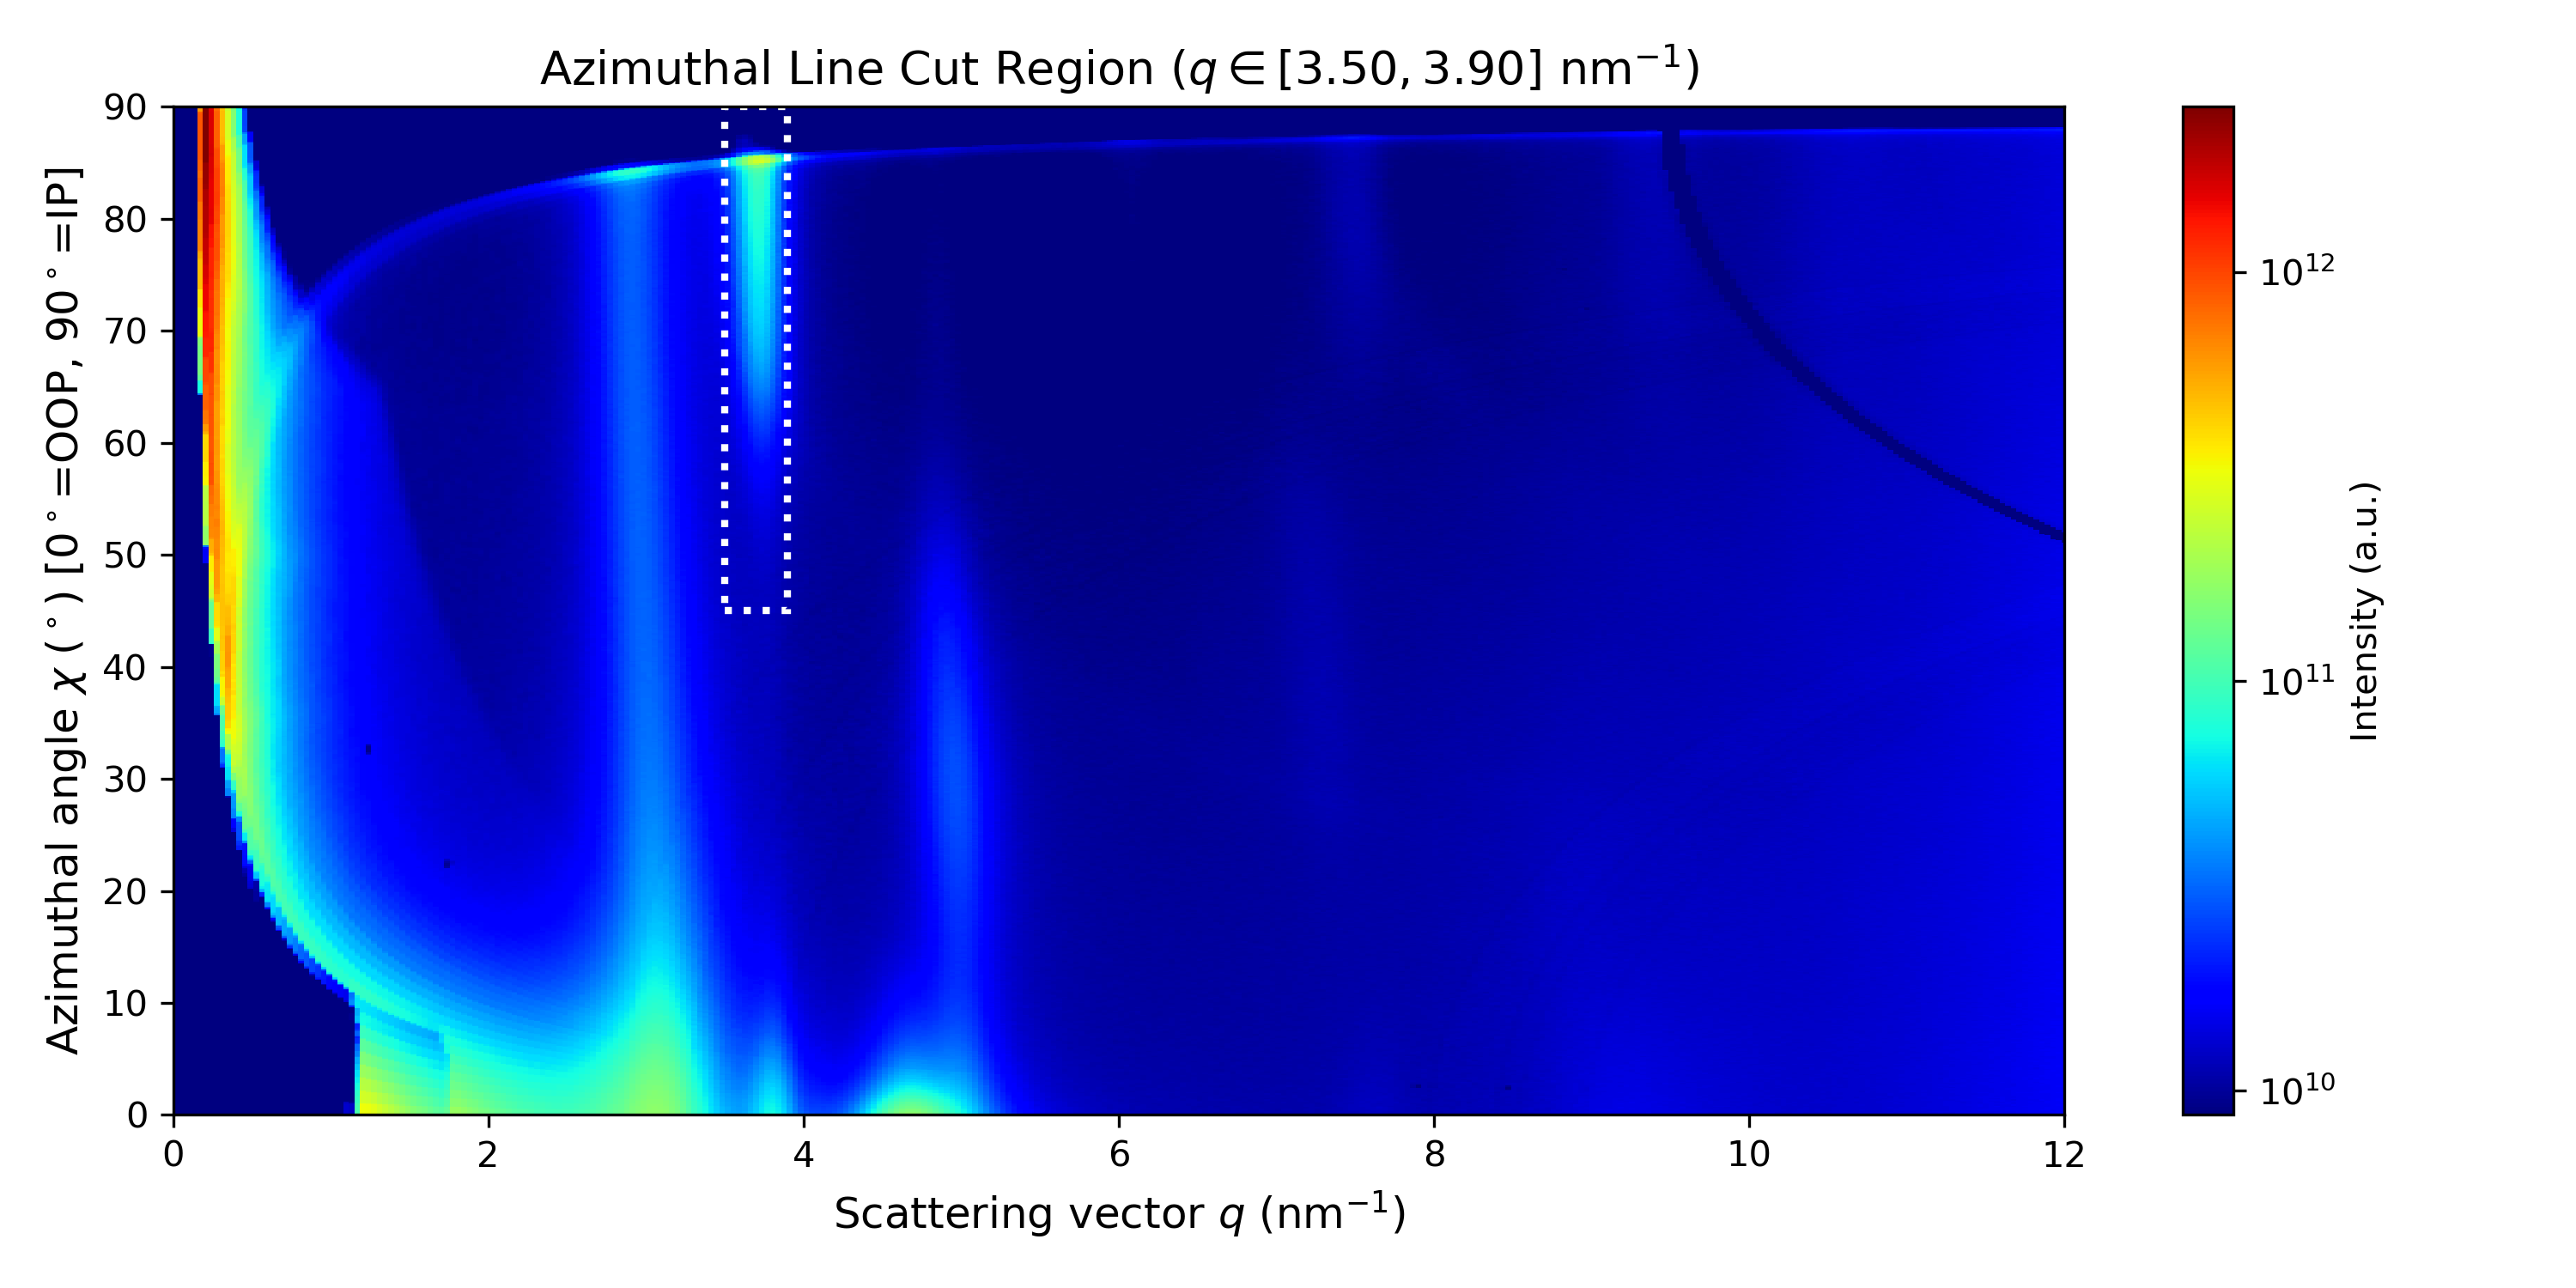
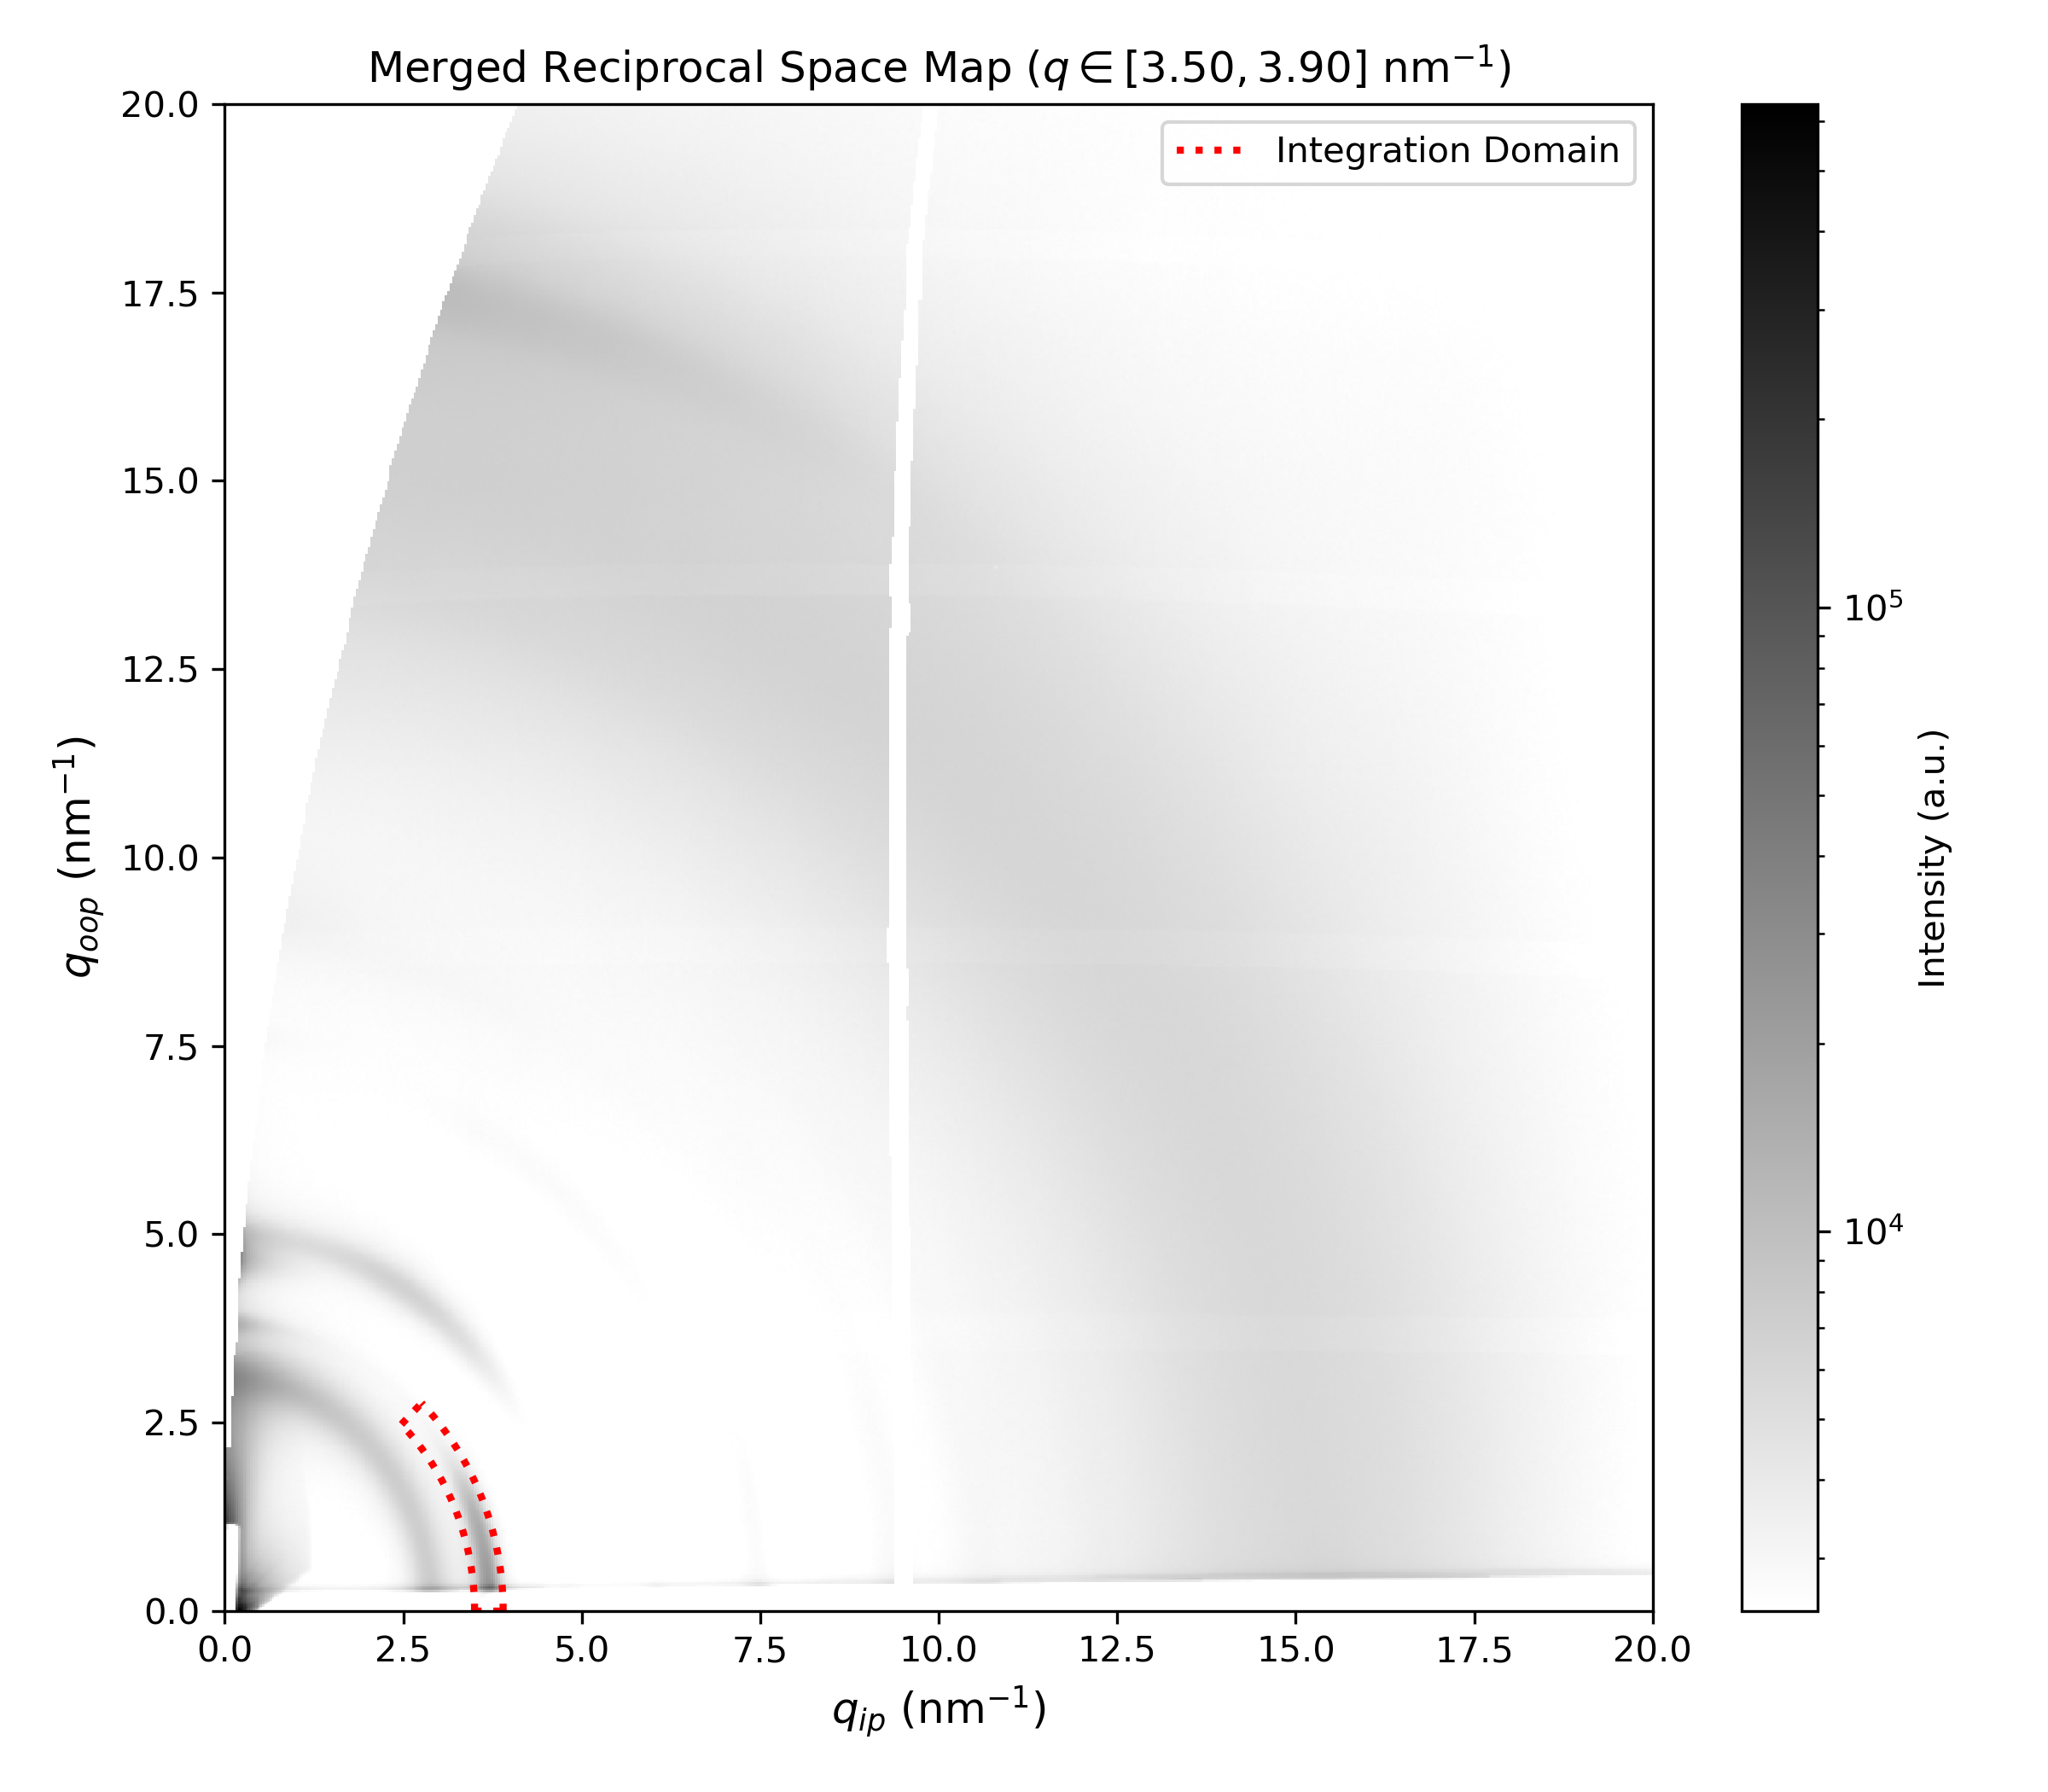
You can adjust the integration boundaries (represented by the borders of the white rectangle on the map, and the red wedge on the image) and then run the cell.
# ==================== User Parameters ====================

# === 1. Integration Boundaries ===
q_min_slice = 3.7 - 0.2
q_max_slice = 3.7 + 0.2

chi_min_slice = 45.0
chi_max_slice = 90.0

# =========================================================

...