In-plane & out-of-plane integration#
Warning: integrations needs to be performed in \(q_{xy}/q_{z}\)#
With a single angle of incidence, it is impossible to fully cover the range of \(q_z\) at \(q_{xy}=0\) due to the limitations of measuring the Ewald sphere with a planar 2D detector [18].
To rigorously obtain the out-of-plane region of reciprocal space at \(q_{xy}=0\), other techniques should be used, such as diffraction in specular conditions (Bragg-Brentano geometry).
An approximation often made is to ignore the corrections required by the Ewald sphere, and integrate on \(q_x\) vs. \(q_z\) maps. In this case, note that comparisons between in-plane and out-of-plane integrations are mostly qualitative, particularly at high \(q_z\) values.
Here, we will be rigourous, and perform integration in \(q_{xy}\) vs \(q_{z}\) maps.
Definition of the integration area#
The in-plane integration will be performed within the black rectangle, while the out-of-plane integration will be performed within the red rectangle. Define the boundaries in the cell below and run it.
# ==================== User Parameters ====================

# Define the left and right boundaries for the out-of-plane integration profile (I vs qoop)
# -> Red rectangle (integration along qoop within this qip window)
left_qip = -0.7   # Set your desired left boundary (in nm^-1)
right_qip = 0.7   # Set your desired right boundary (in nm^-1)

# Define the bottom and top boundaries for the in-plane integration profile (I vs qip)
# -> Black rectangle (integration along qip within this qoop window)
bottom_qoop = 0.3   # Bottom boundary (in nm^-1)
top_qoop = 0.7      # Top boundary (in nm^-1)

# =========================================================

...
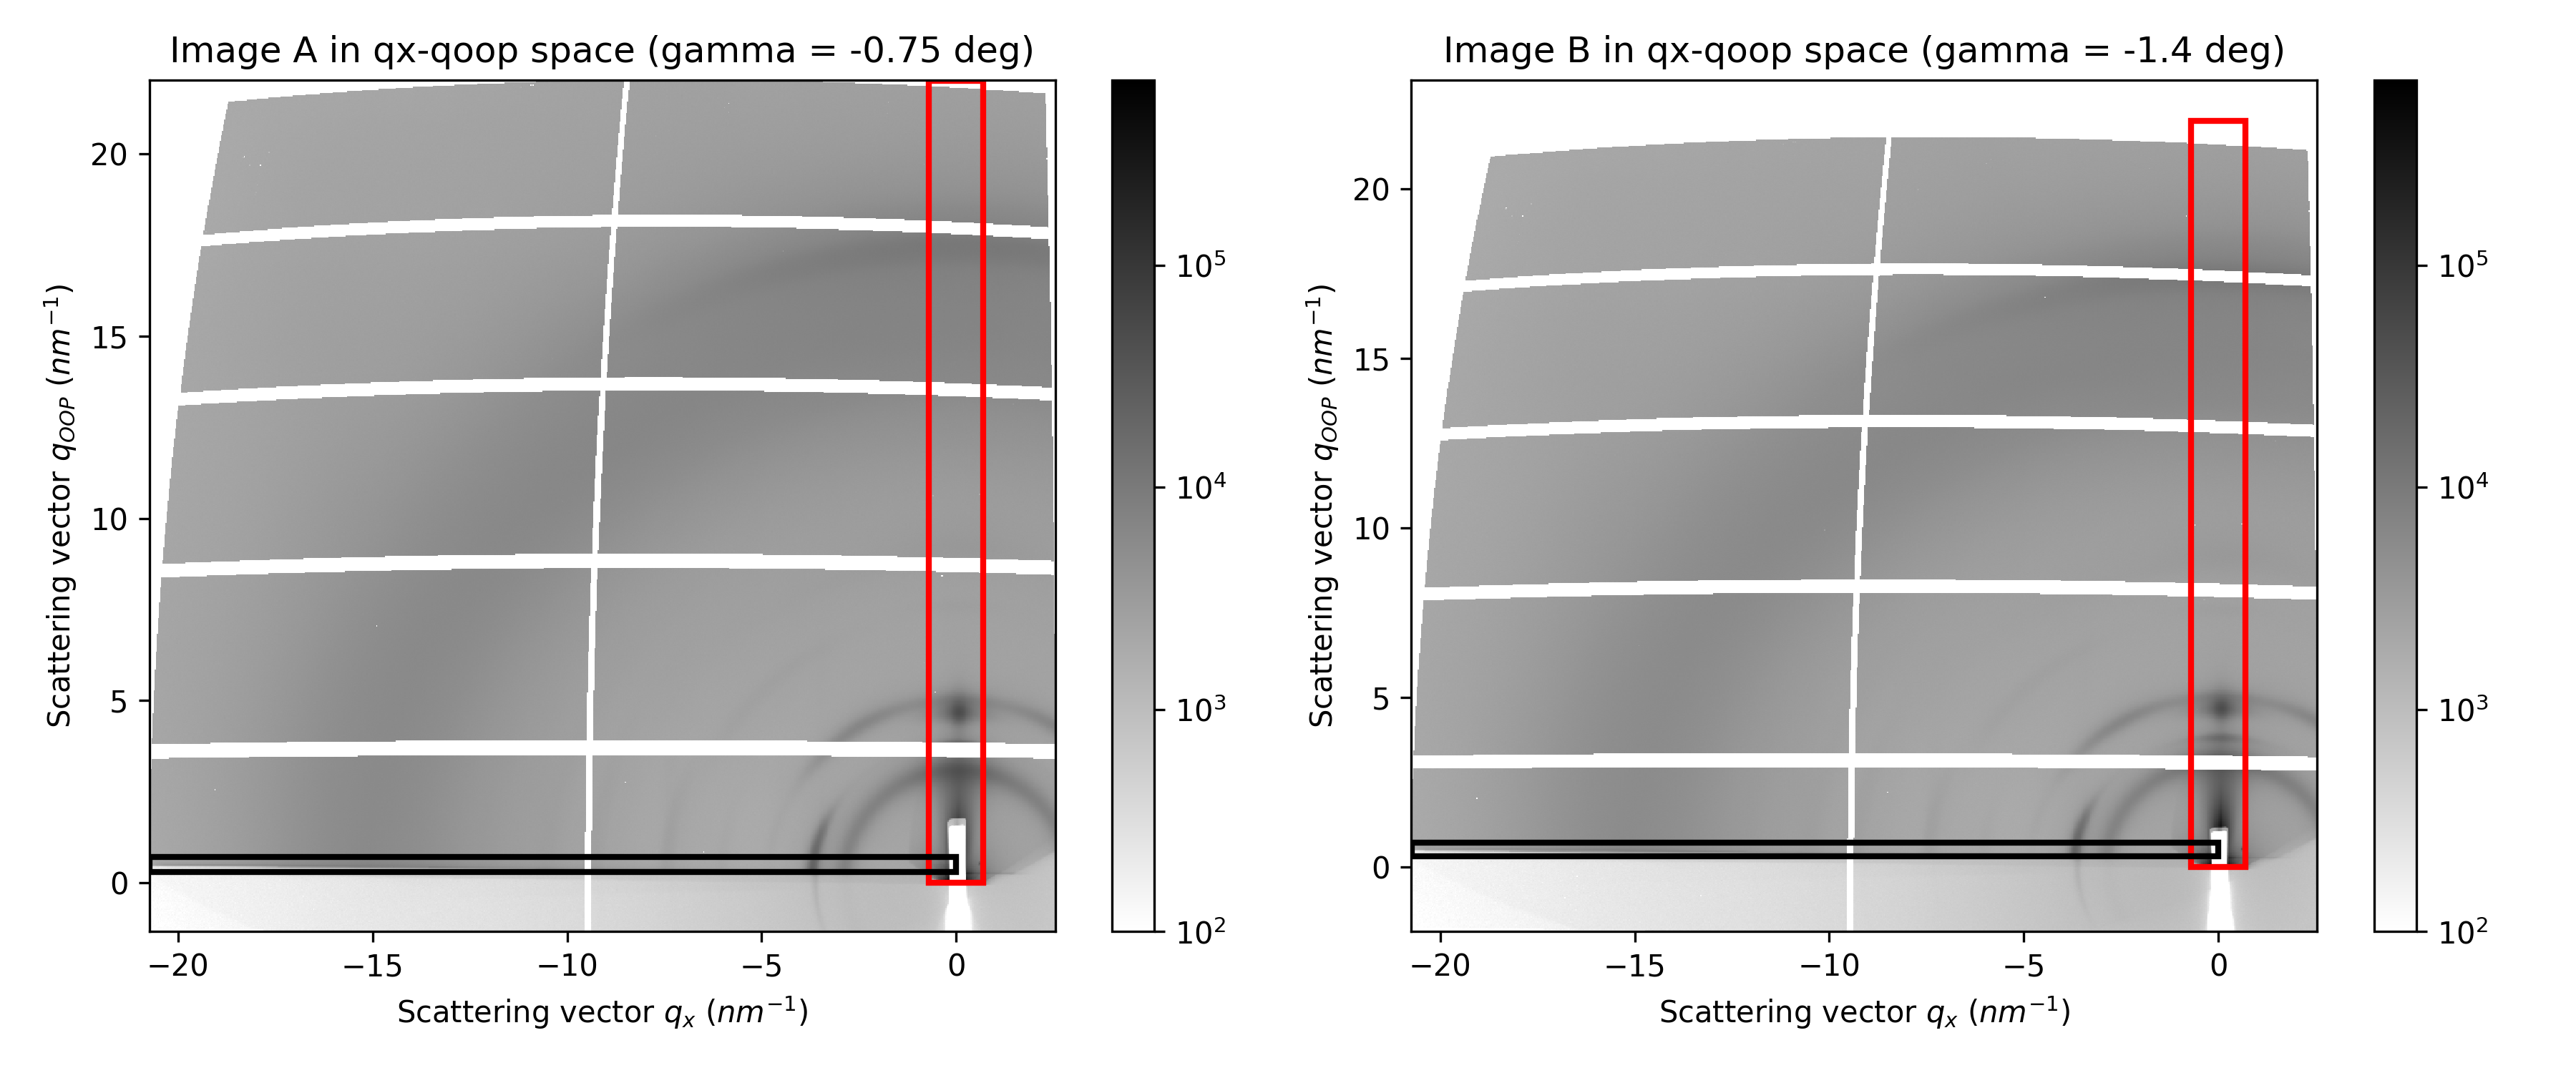
Performing the integration#
Once you are satisfied with the boundaries, adjust the limits of the final plot in the next cell and run it.
# Define the limits of the plot and run the cell
q_min = 2
q_max = 20

...
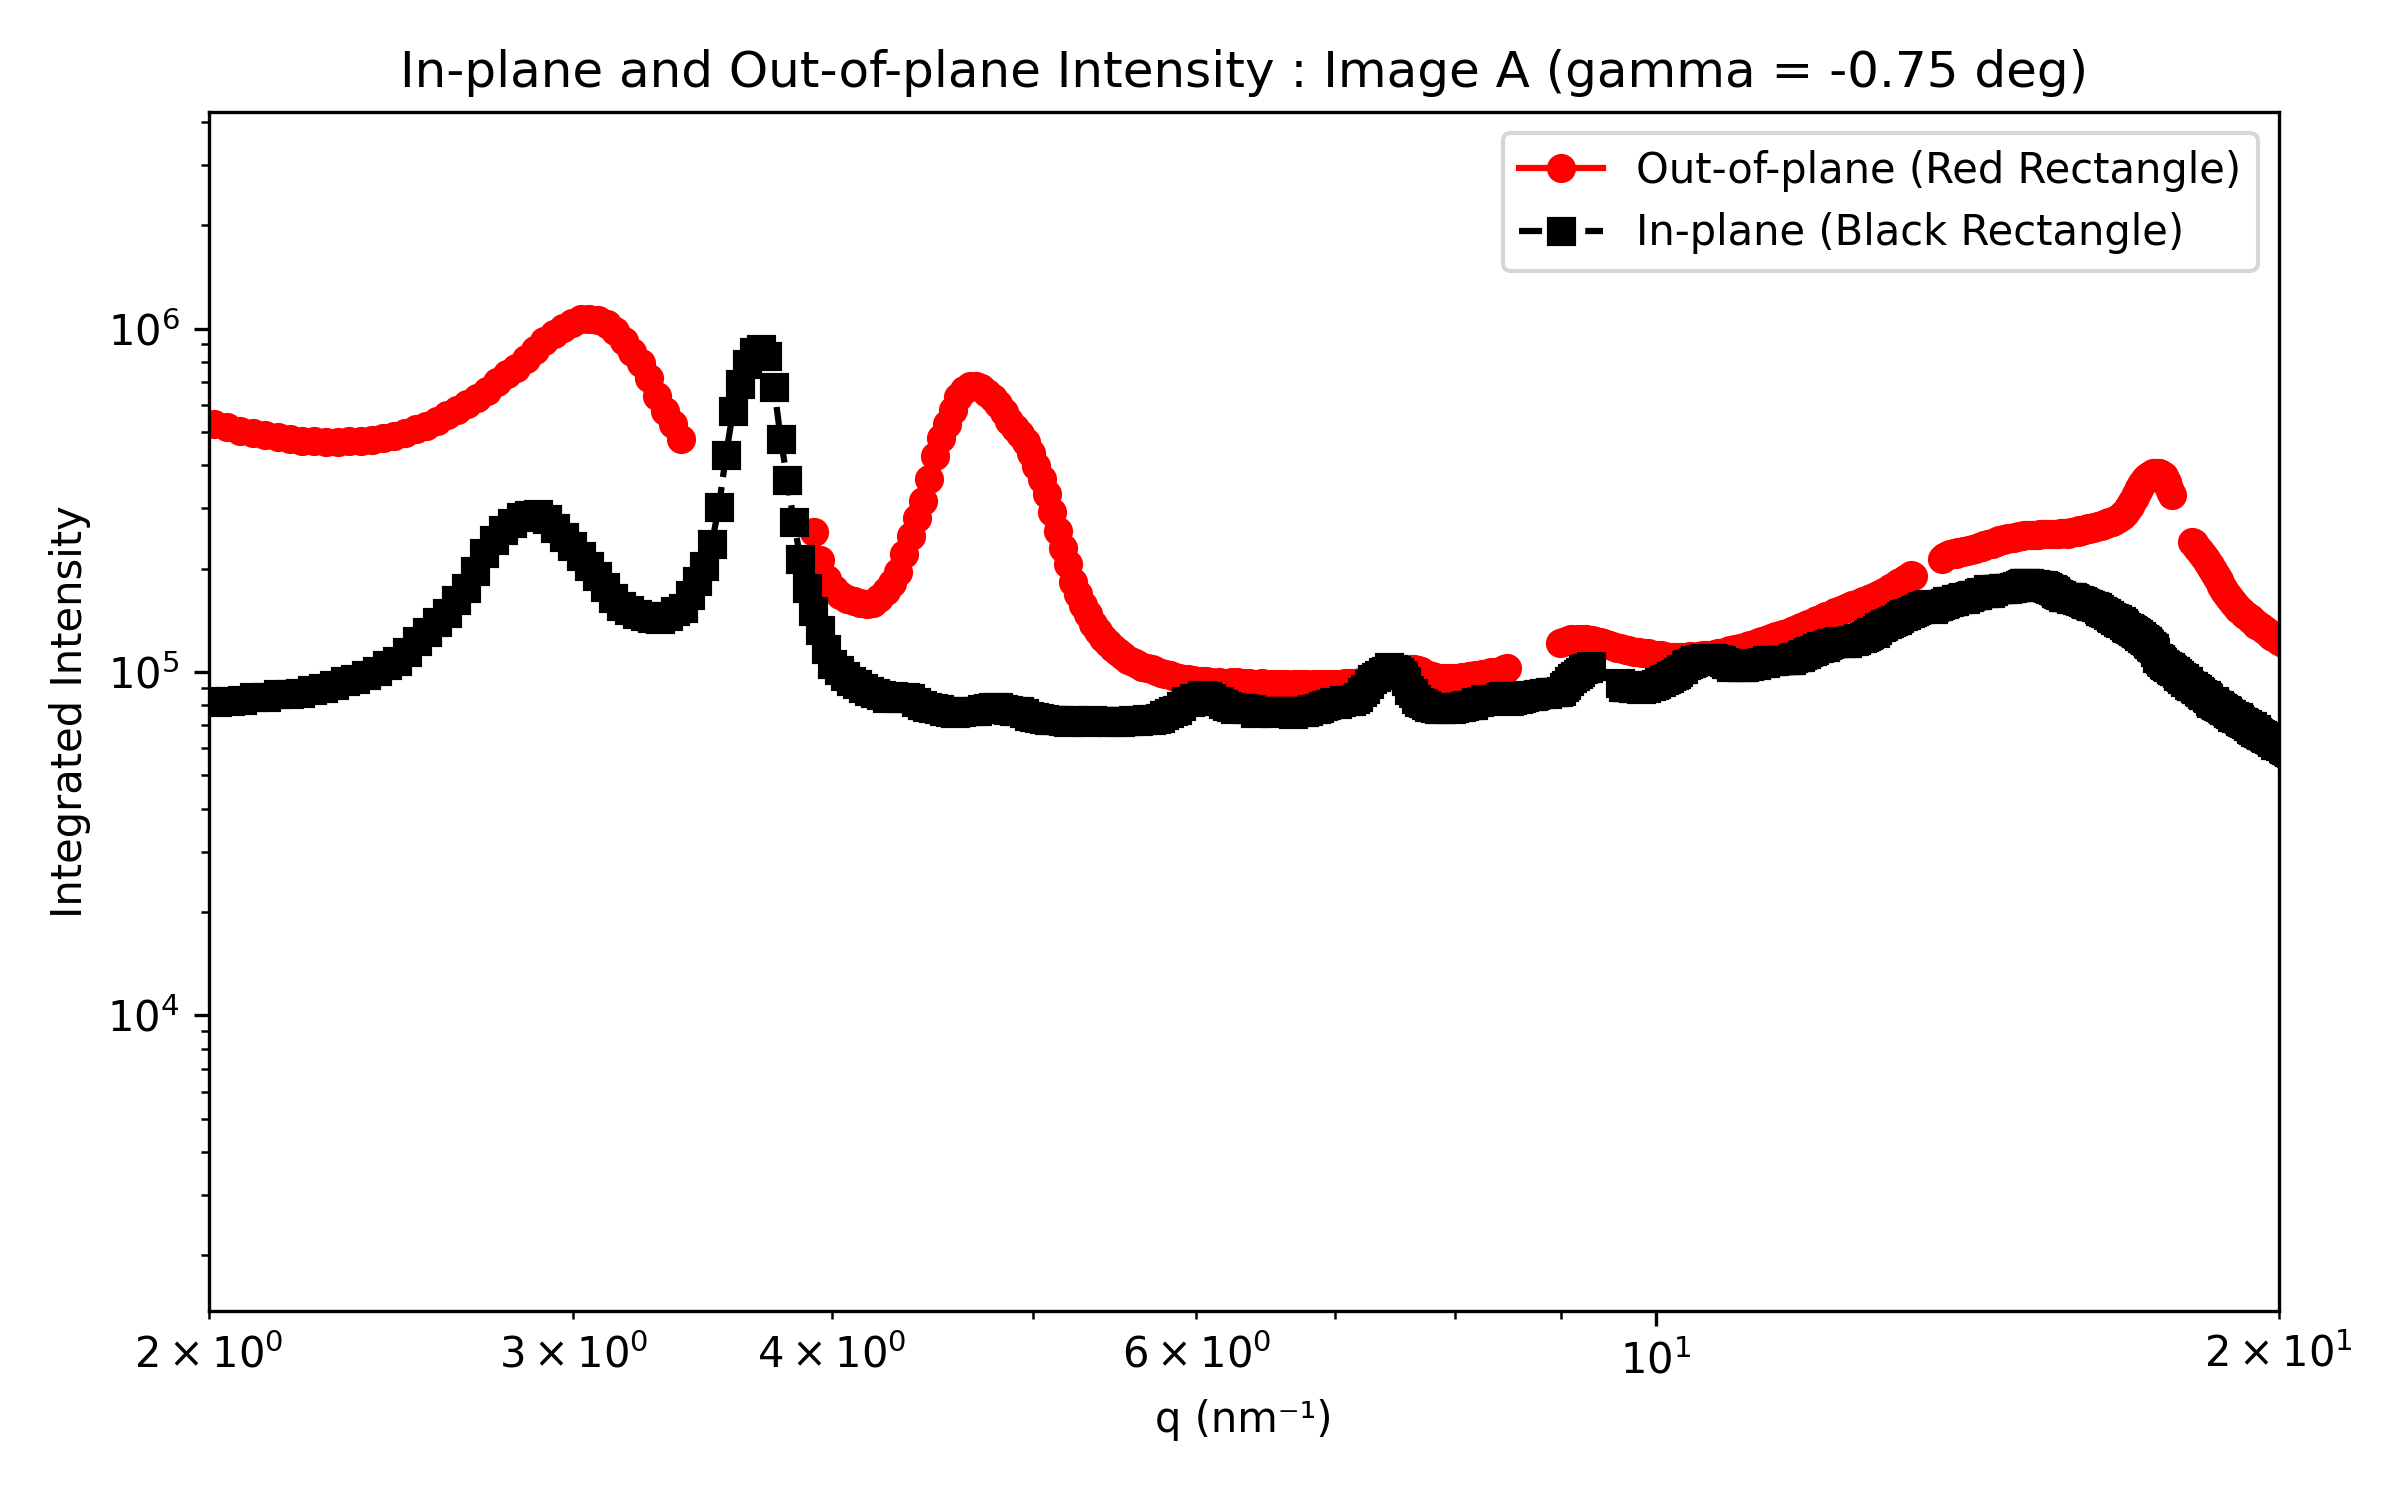
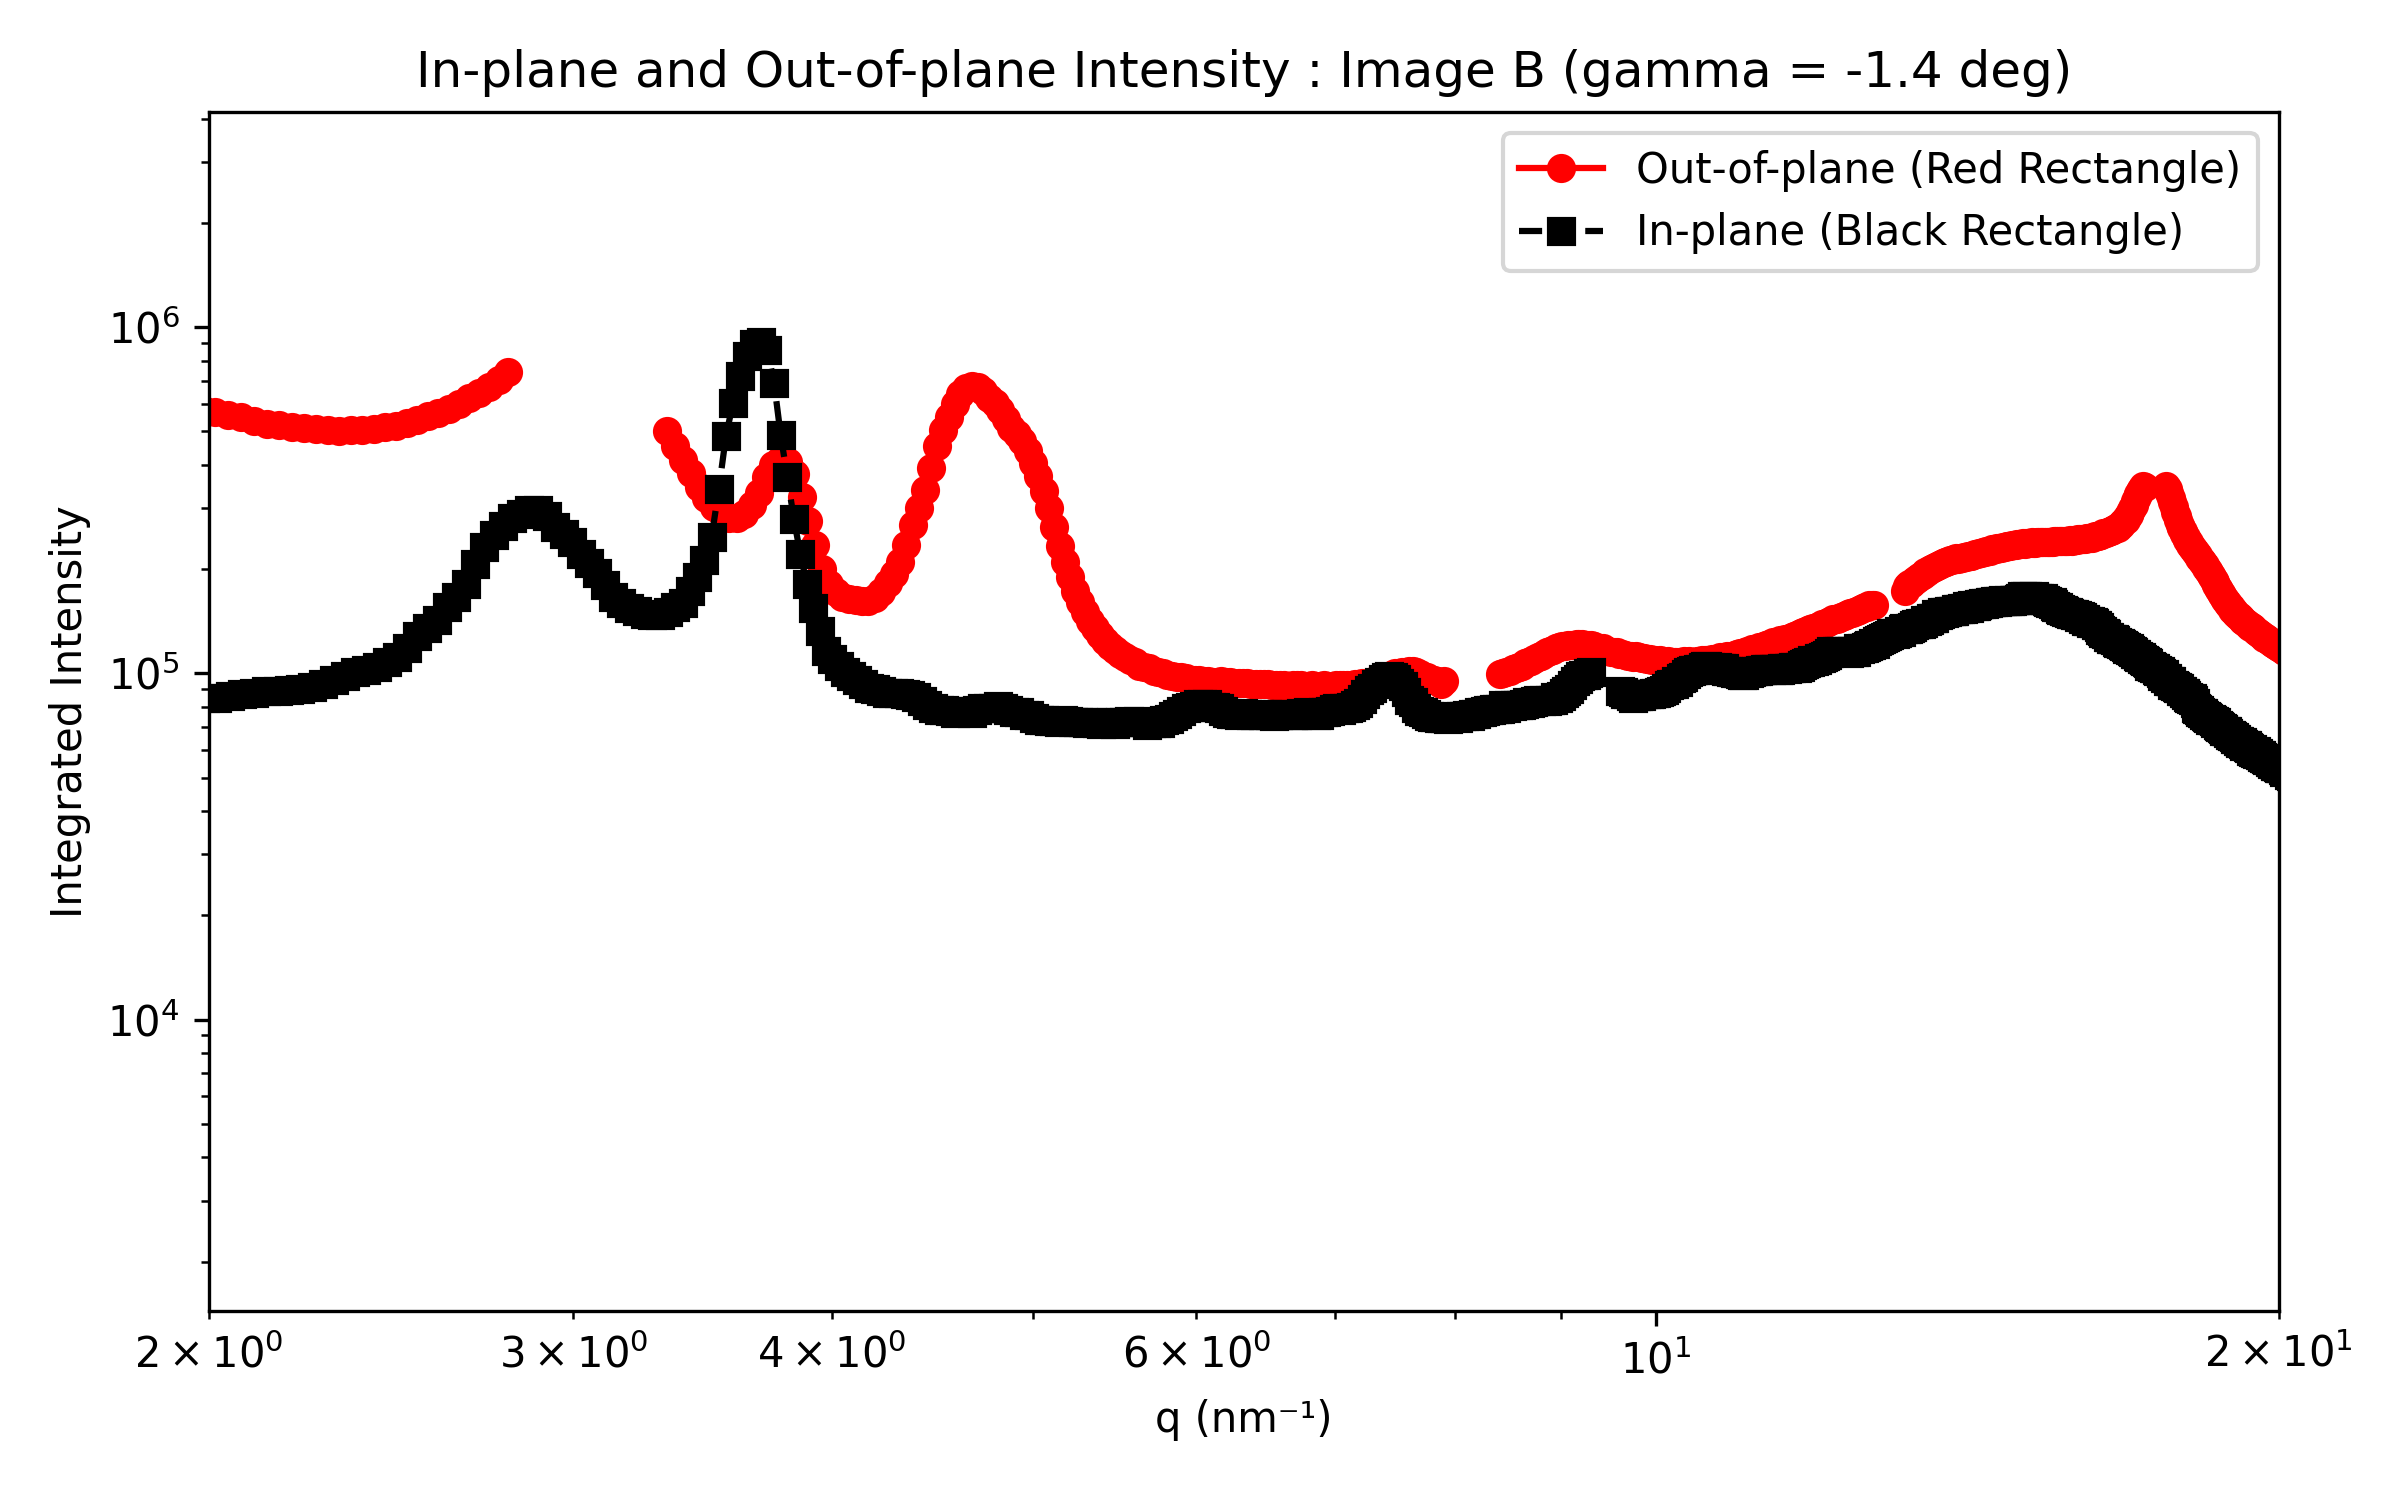
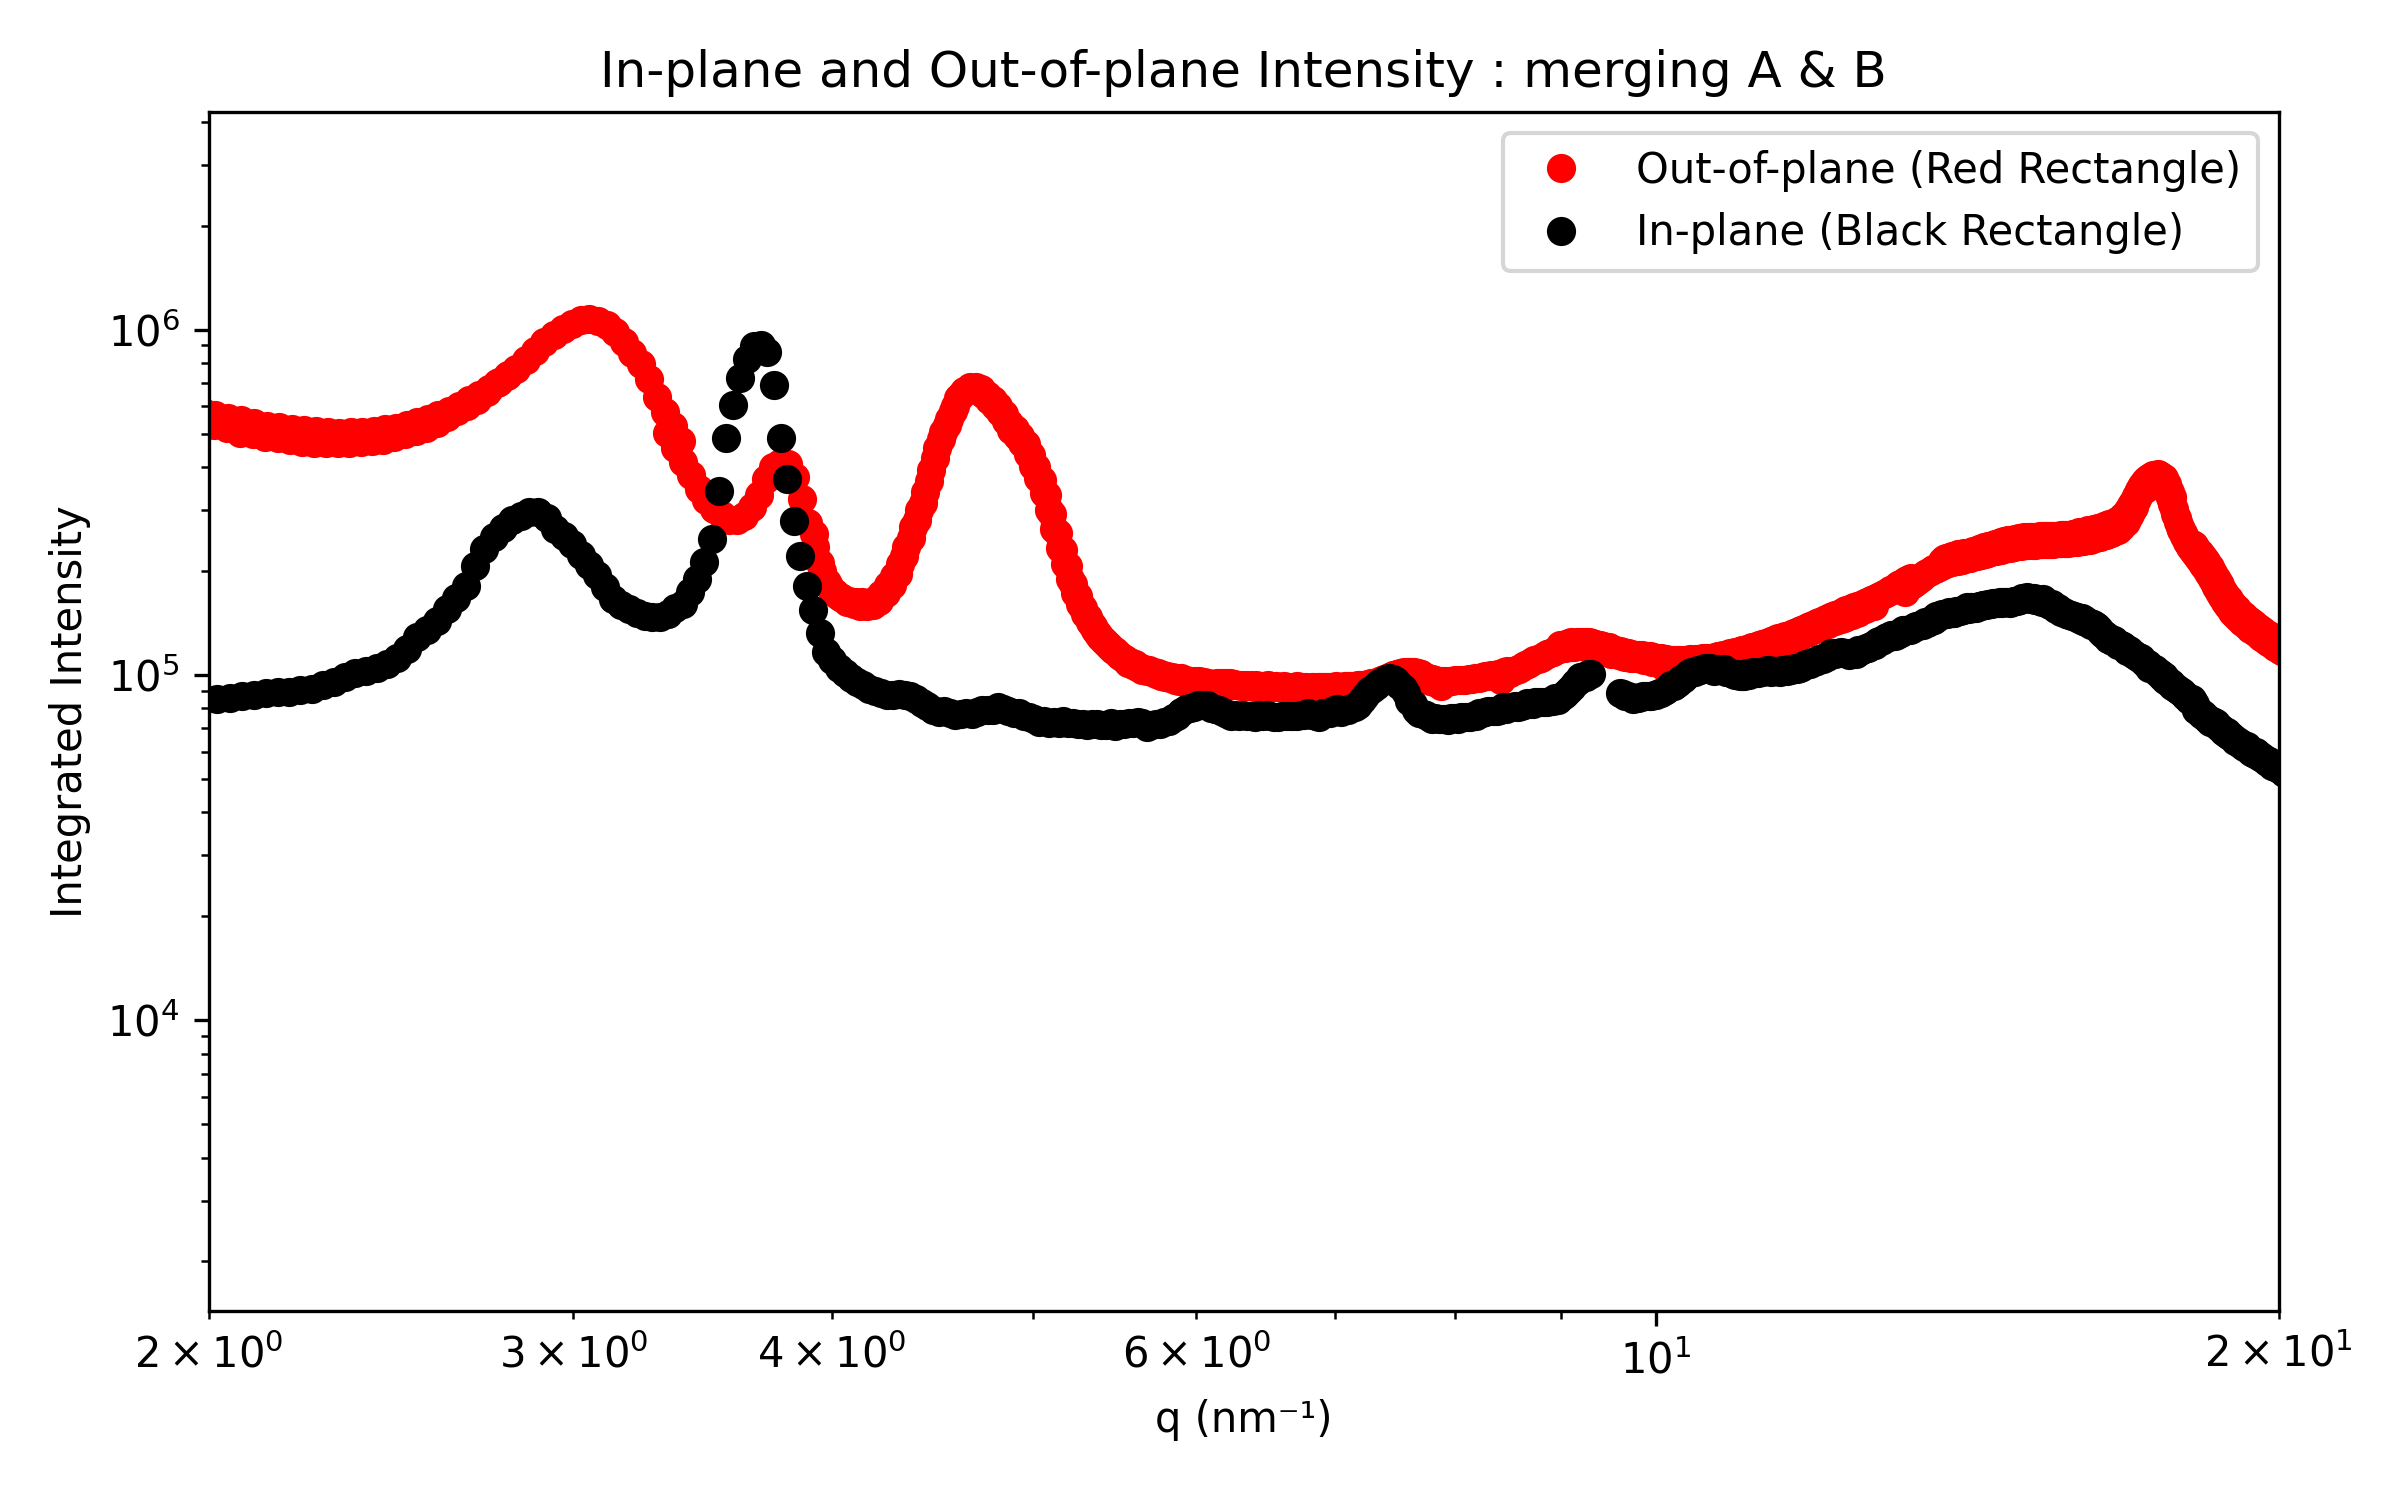
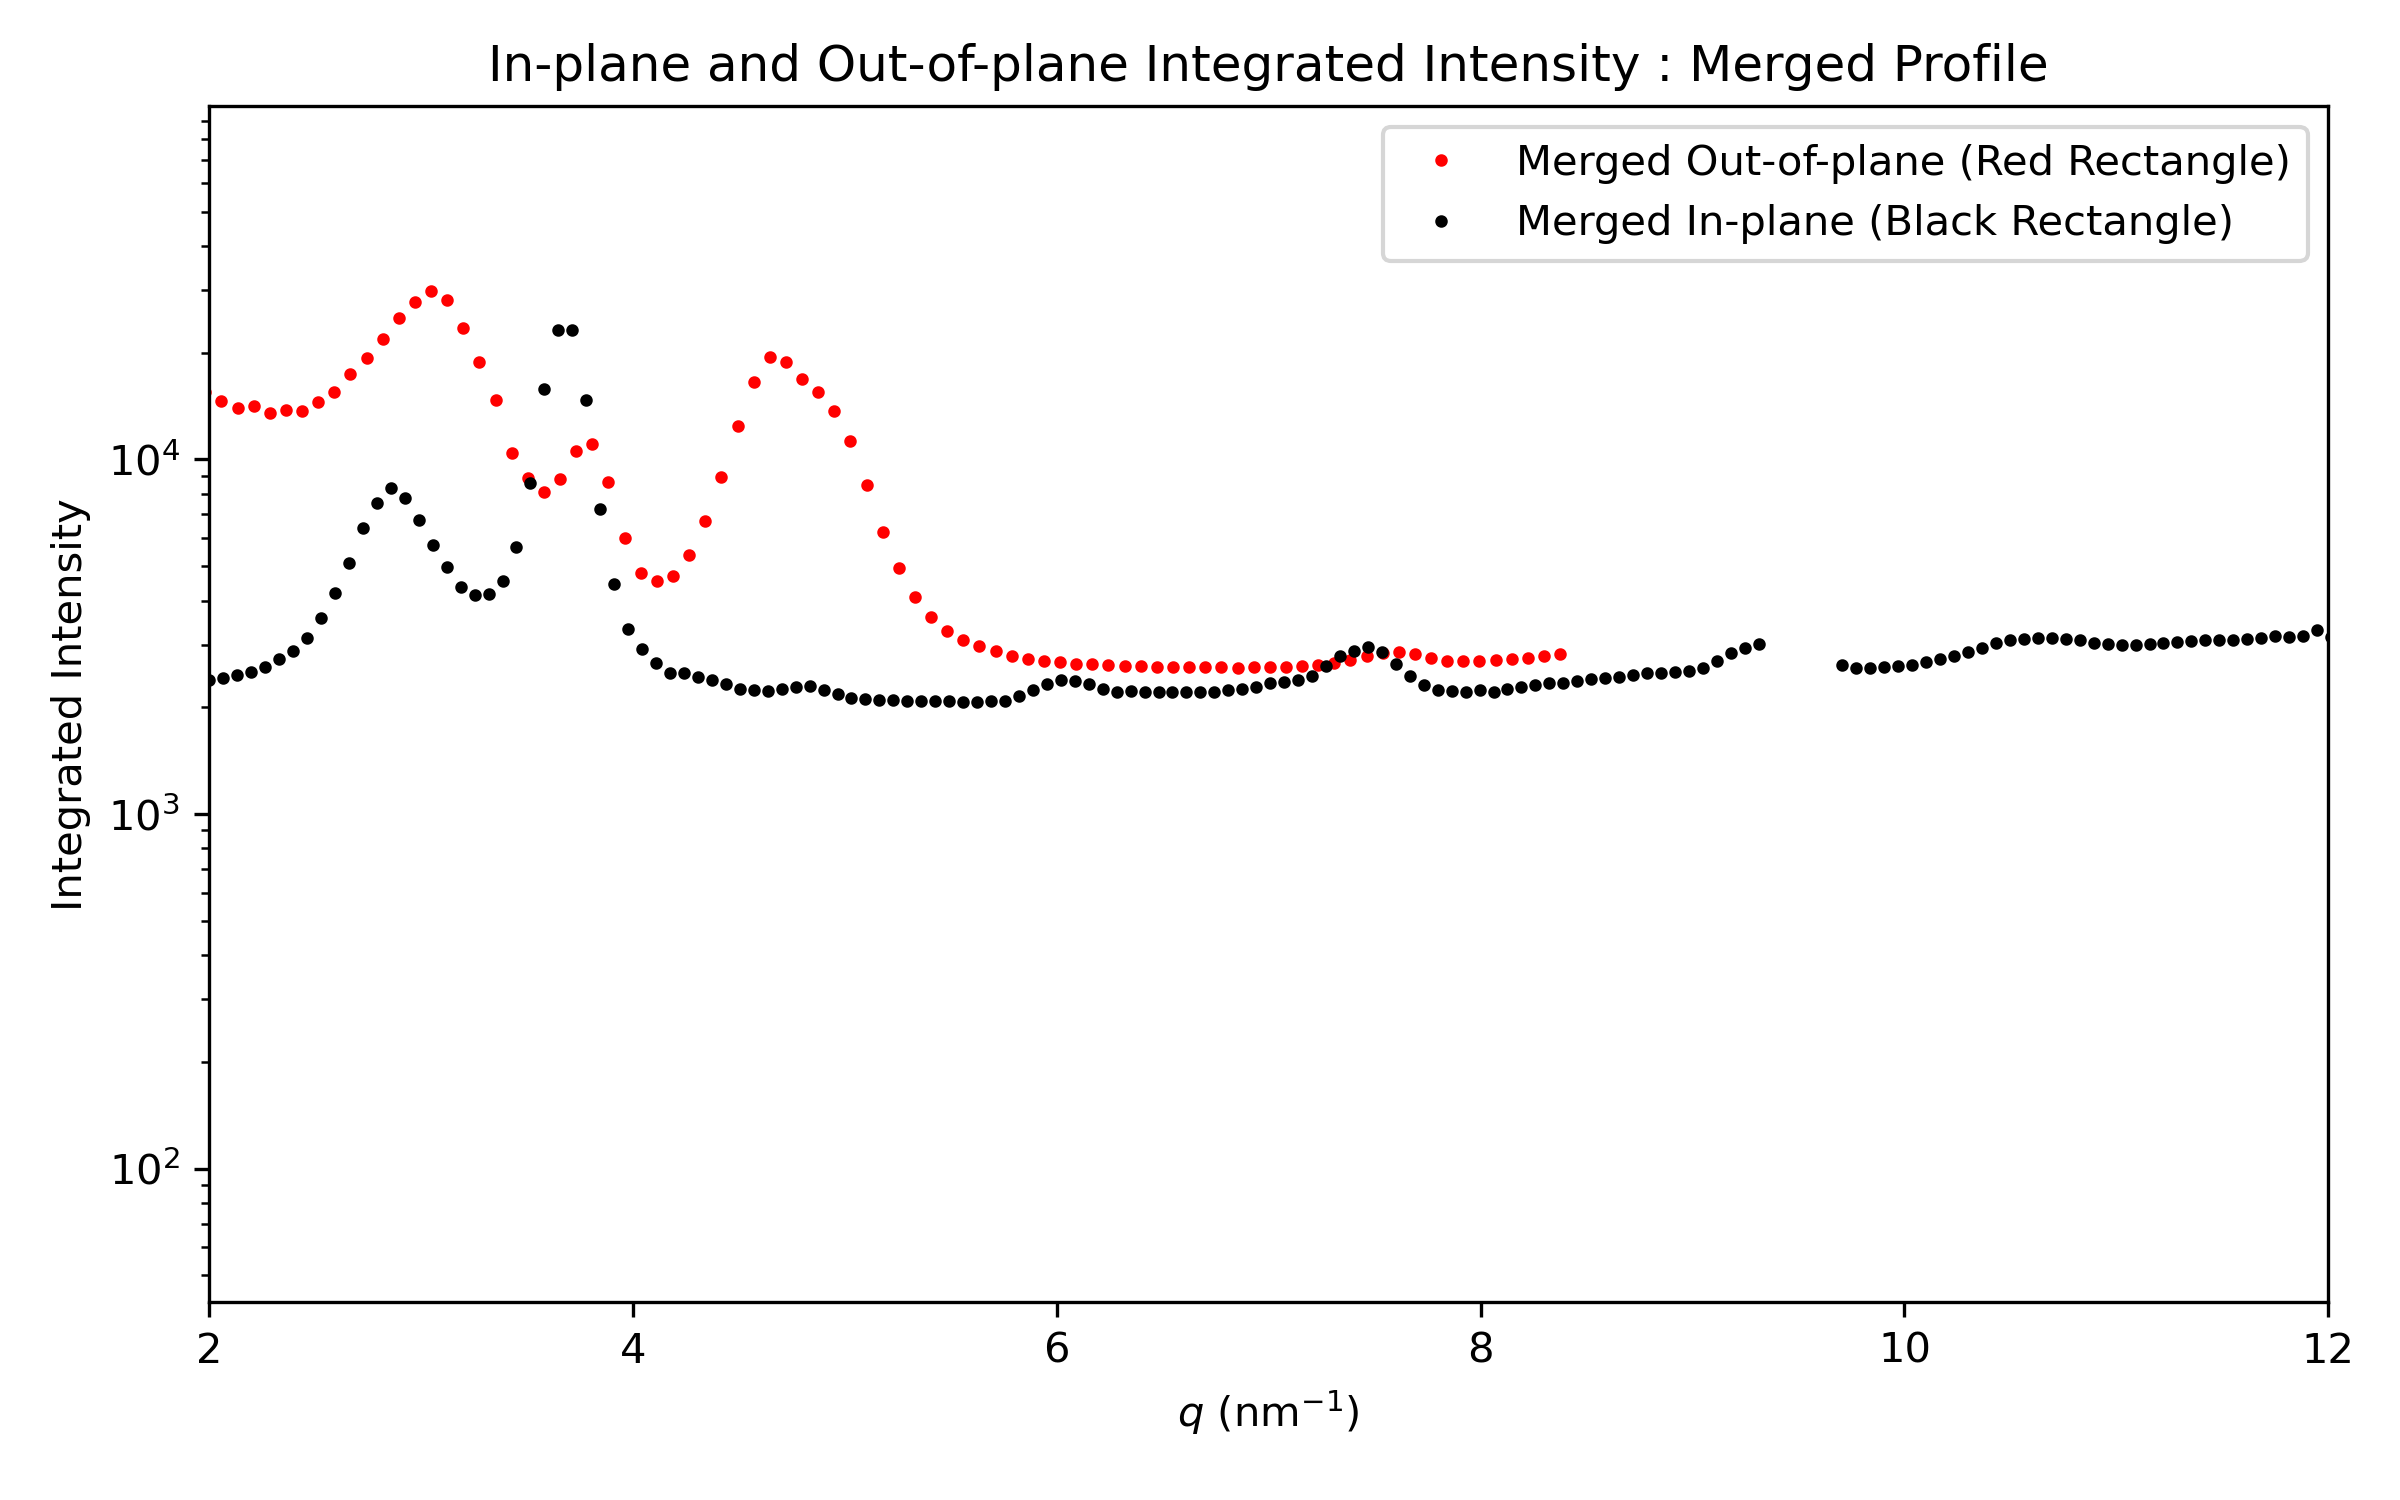
The in-plane and out-of-plane intensity profiles will be generated for each image individually. In the final plots, the datasets will be combined to remove gaps caused by dead zones.
In your further analysis, you can choose whether to:
keep both datasets separate, if for example there is a mismatch between images A and B (beam damage, possibly),
use the merged one, if the comparison between A and B is satisfying.