Azimuthal map#
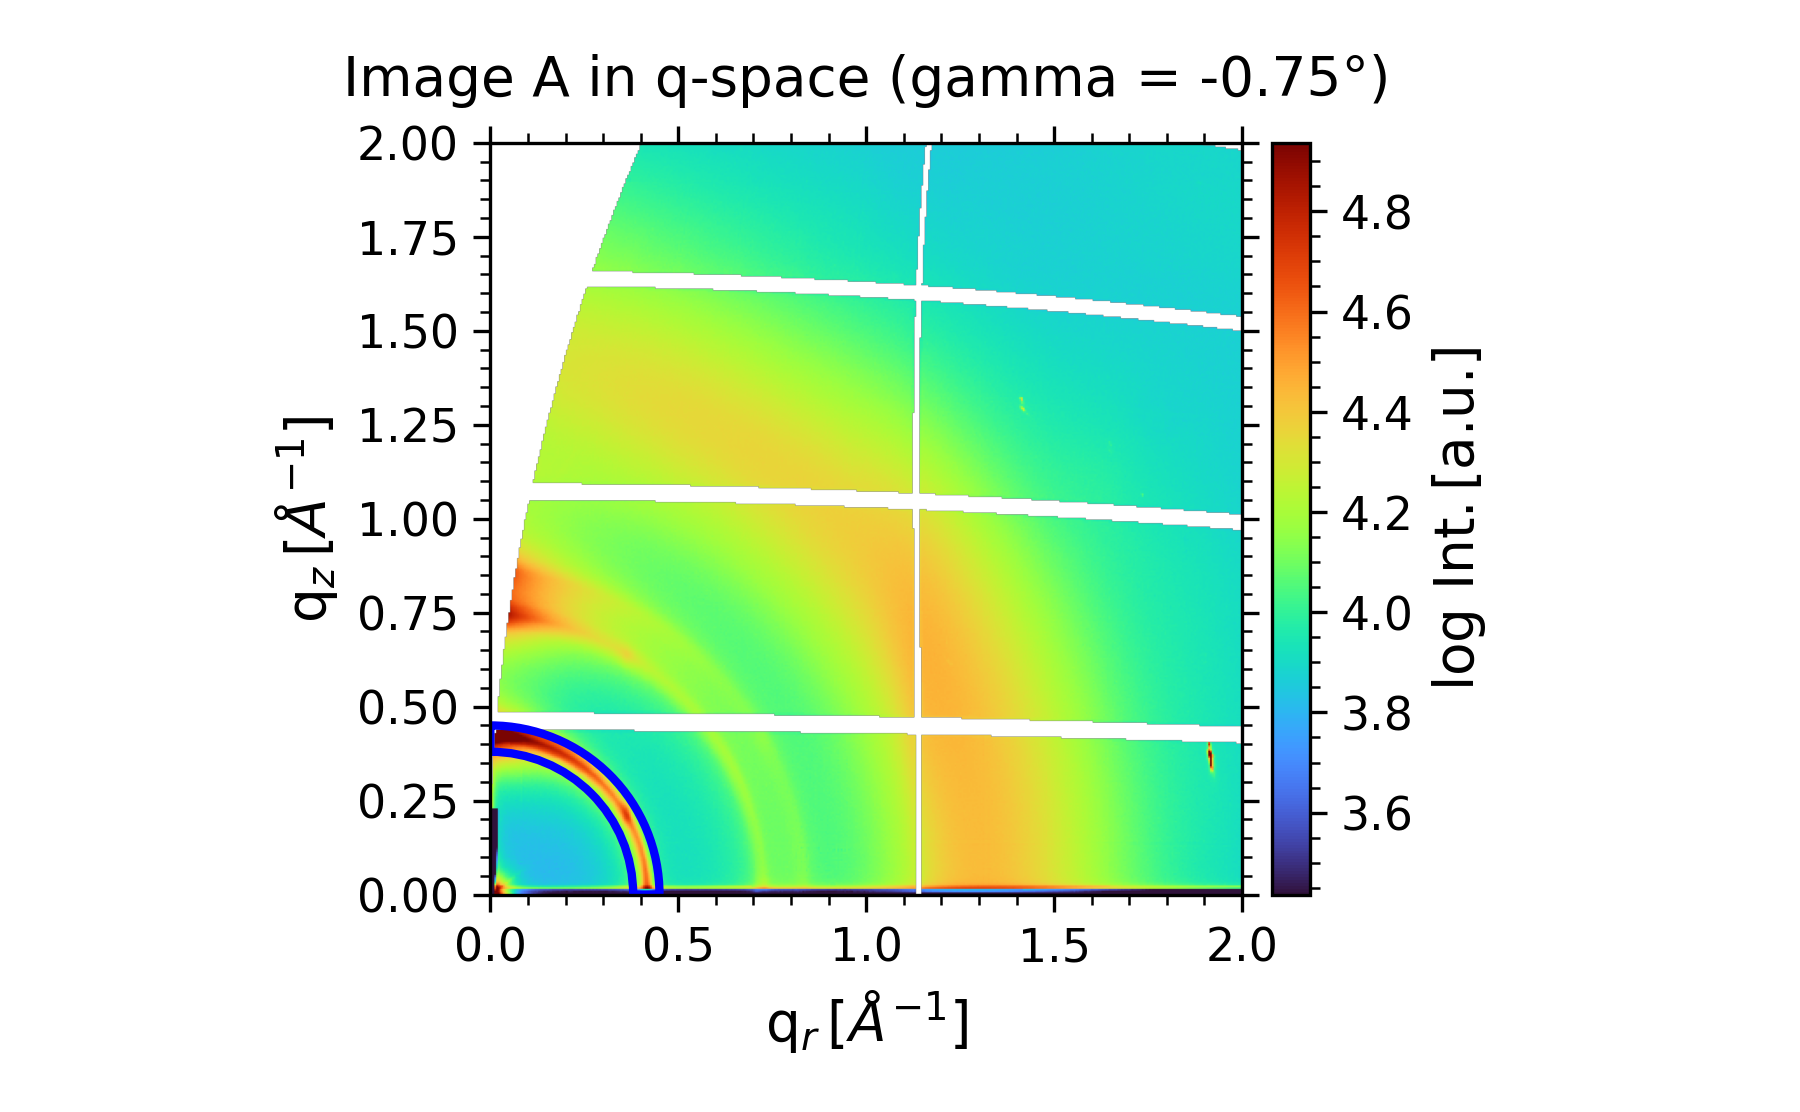
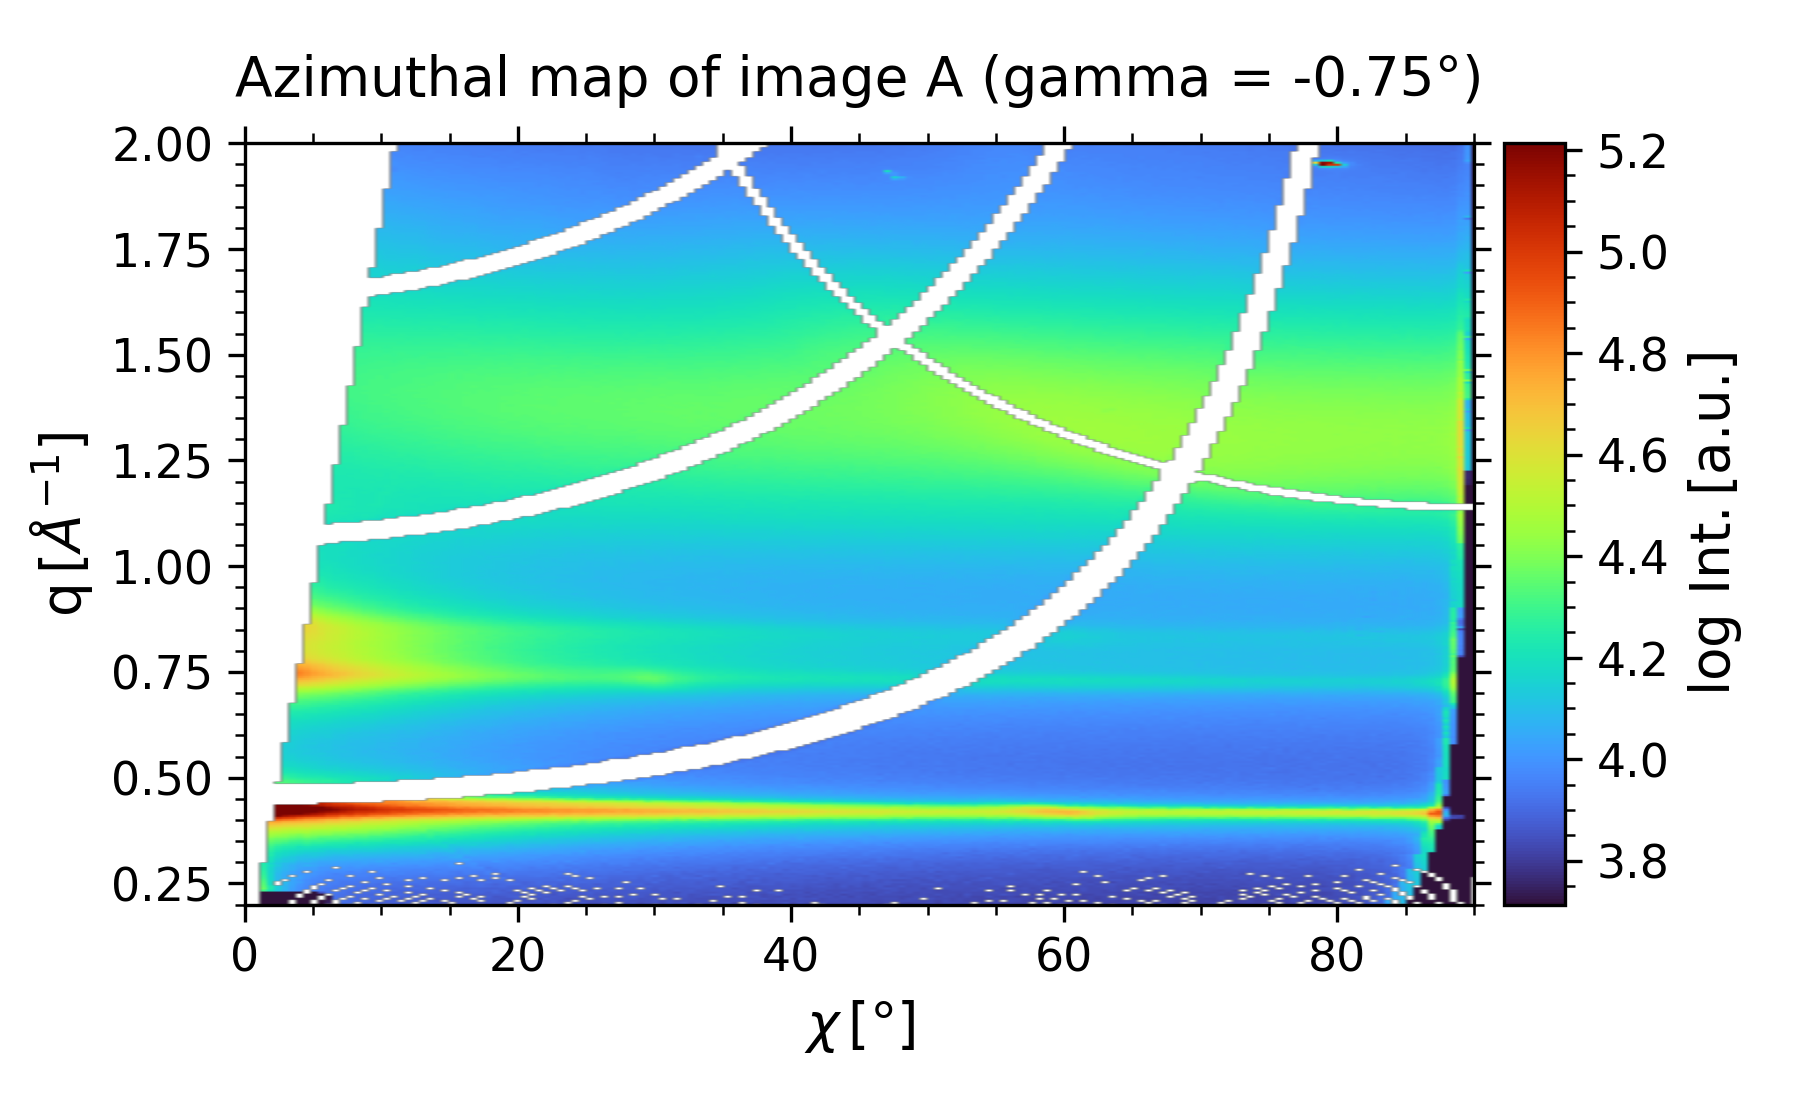
In this step, we will extract the azimuthal map, which is useful for analyzing texturing effects.
You can adjust the q-range* to be displayed in the image, then run the cell.
# Modify the q range you want to reach in the image, and run the cell
q_range = (0.2, 2.)
...
Running the cell will generate the maps.
Azimuthal tube#
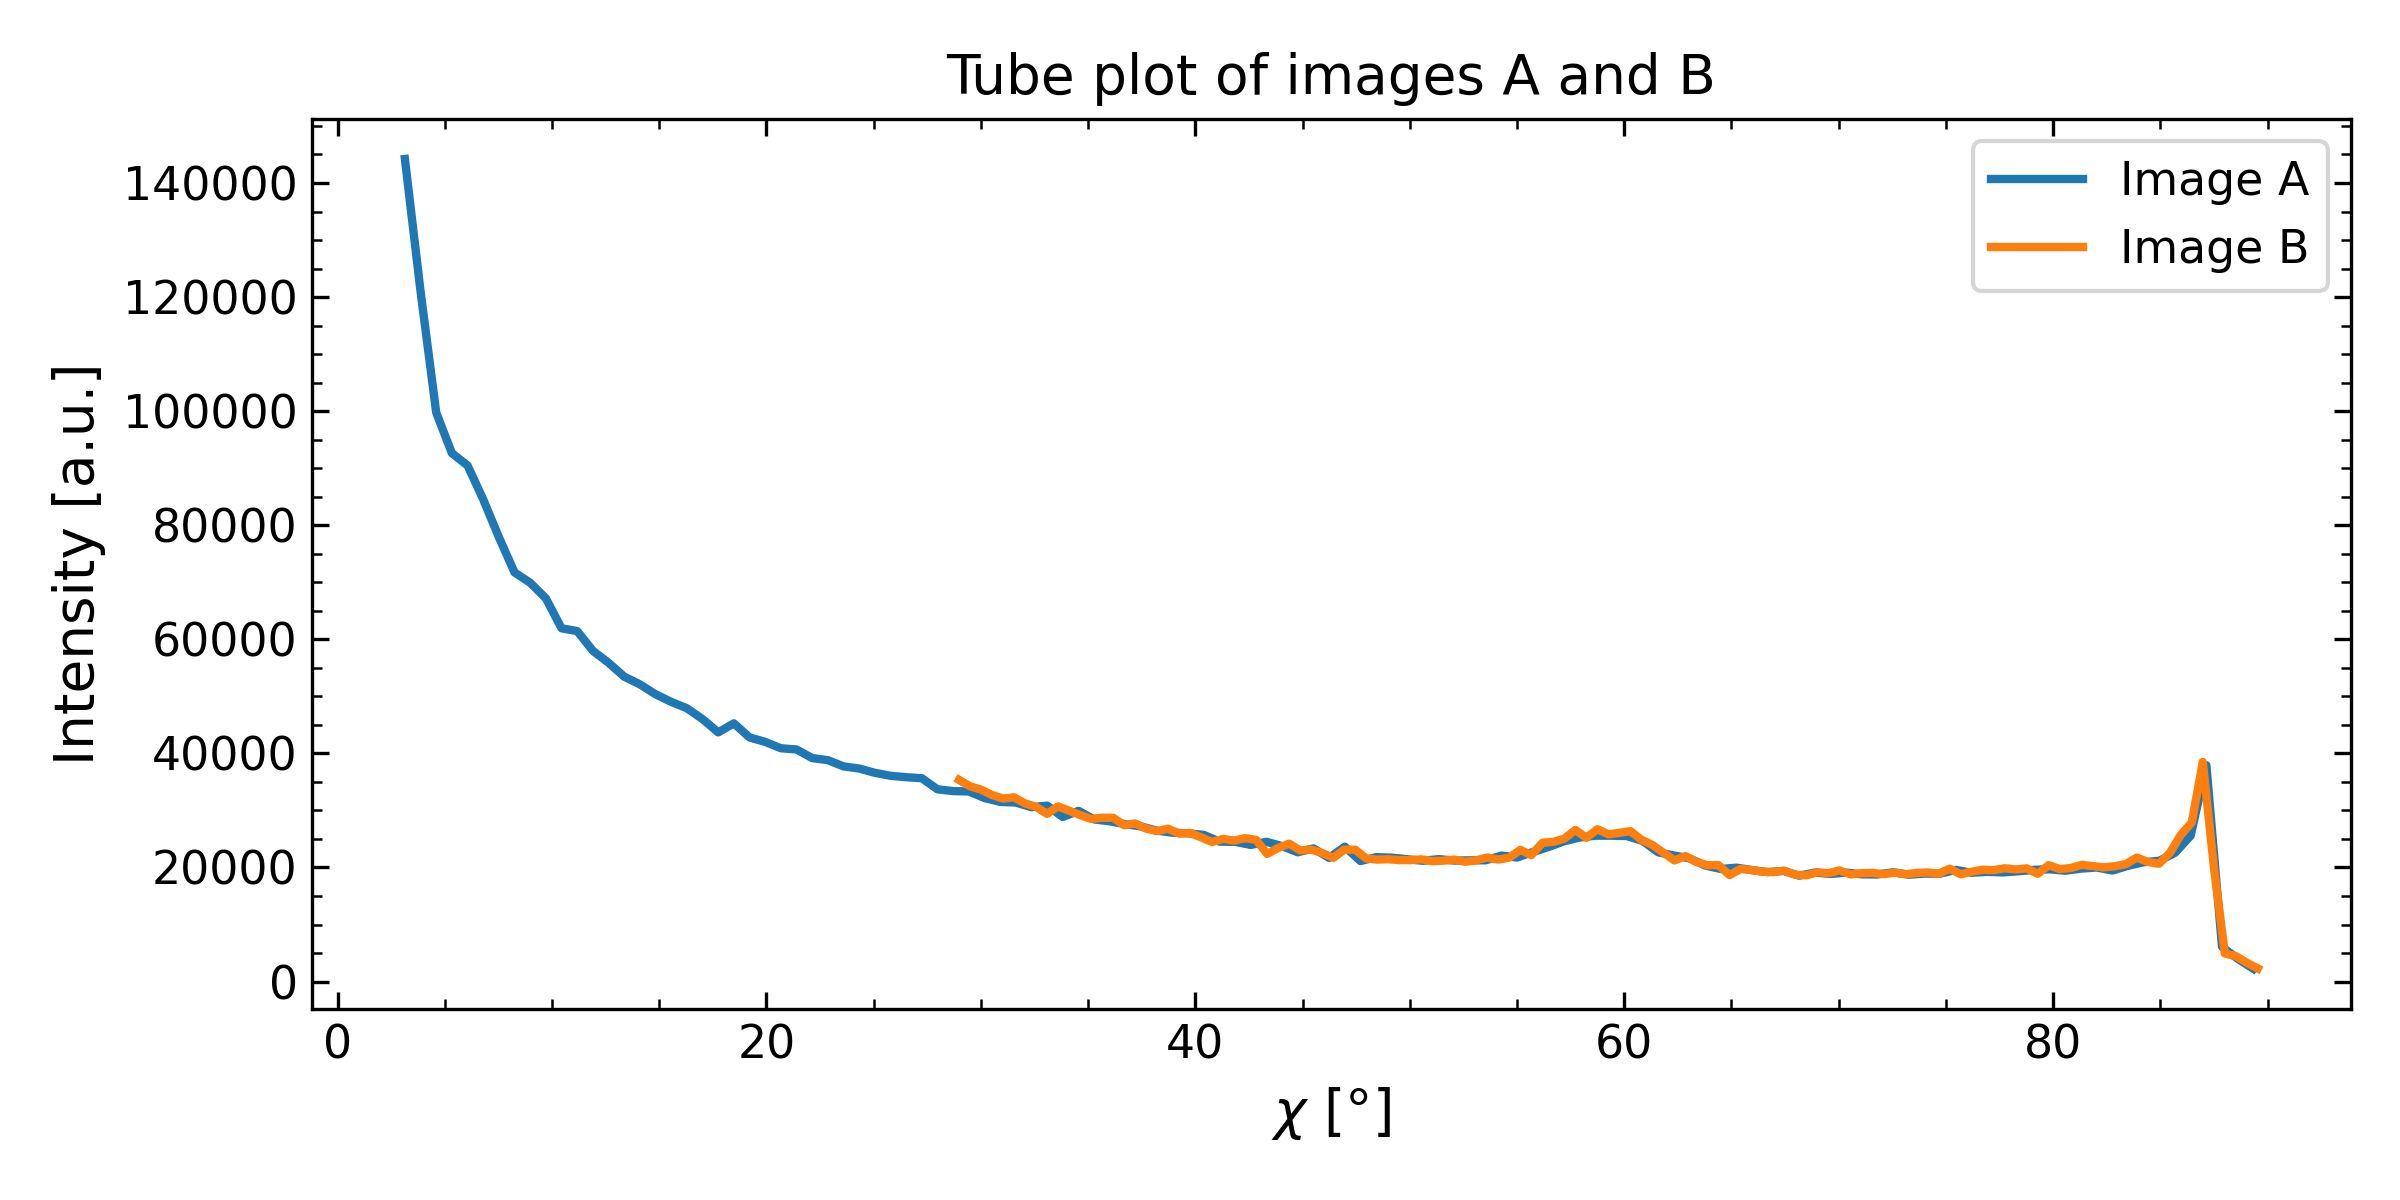
Now, we need to define the integration region on the 2D map to obtain the intensity vs. azimuthal angle (\(\chi\)) plot.
You can adjust the integration boundaries and number of points, and then run the cell.
# Modify the parameters, and run the cell
npt_tube_plot = 120
azimuth_range = (0,90) # in deg
q_range = (0.38, 0.45) # in A-1

...