Powder plot#
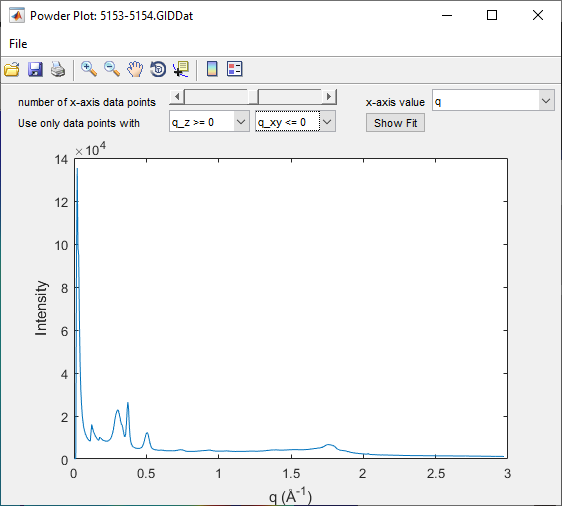
A powder plot represents the intensity as a function of the q vector, defined as \(q=\sqrt{q_{xy}^2+q_z^2}\). This allows for comparison with powder diffractograms obtained from other sources.
Generate the powder plot#
Select the Image: Choose the merged image of scans 5151 and 5152.
Open LineScan: Click on the
LINEicon (LineScan over whole image). This opens thePowder Plotwindow.
Configure the plot#
Binning: Adjust the binning by changing the
number of x-axis data points. For consistency across comparisons, it’s recommended to leave this setting unchanged.Units: Choose to display the data as a function of either \(q\) or \(2\theta\). Selecting \(2\theta\) is particularly useful when comparing with powder diffractograms obtained using the Cu K\(\rm \alpha\)1 X-ray emission line.
Data Selection: Focus on data points with \(q_z > 0\) and \(q_{xy} < 0\) to:
Maintain resolution in \(q_{xy}\).
Prevent peak splitting if the direct beam isn’t perfectly centered at \(q_{xy} = 0\).
Analyze or export the plot#
Fitting: GIDVis provides tools to fit the peak positions. However, you may find it easier to export the data and analyze it using your preferred fitting software.
Export Data:
Click on
File > Export Line Data....Select
Export and Close.
The exported text file contains the powder plot data in a two-column format, suitable for further analysis.