Powder & cake plot#
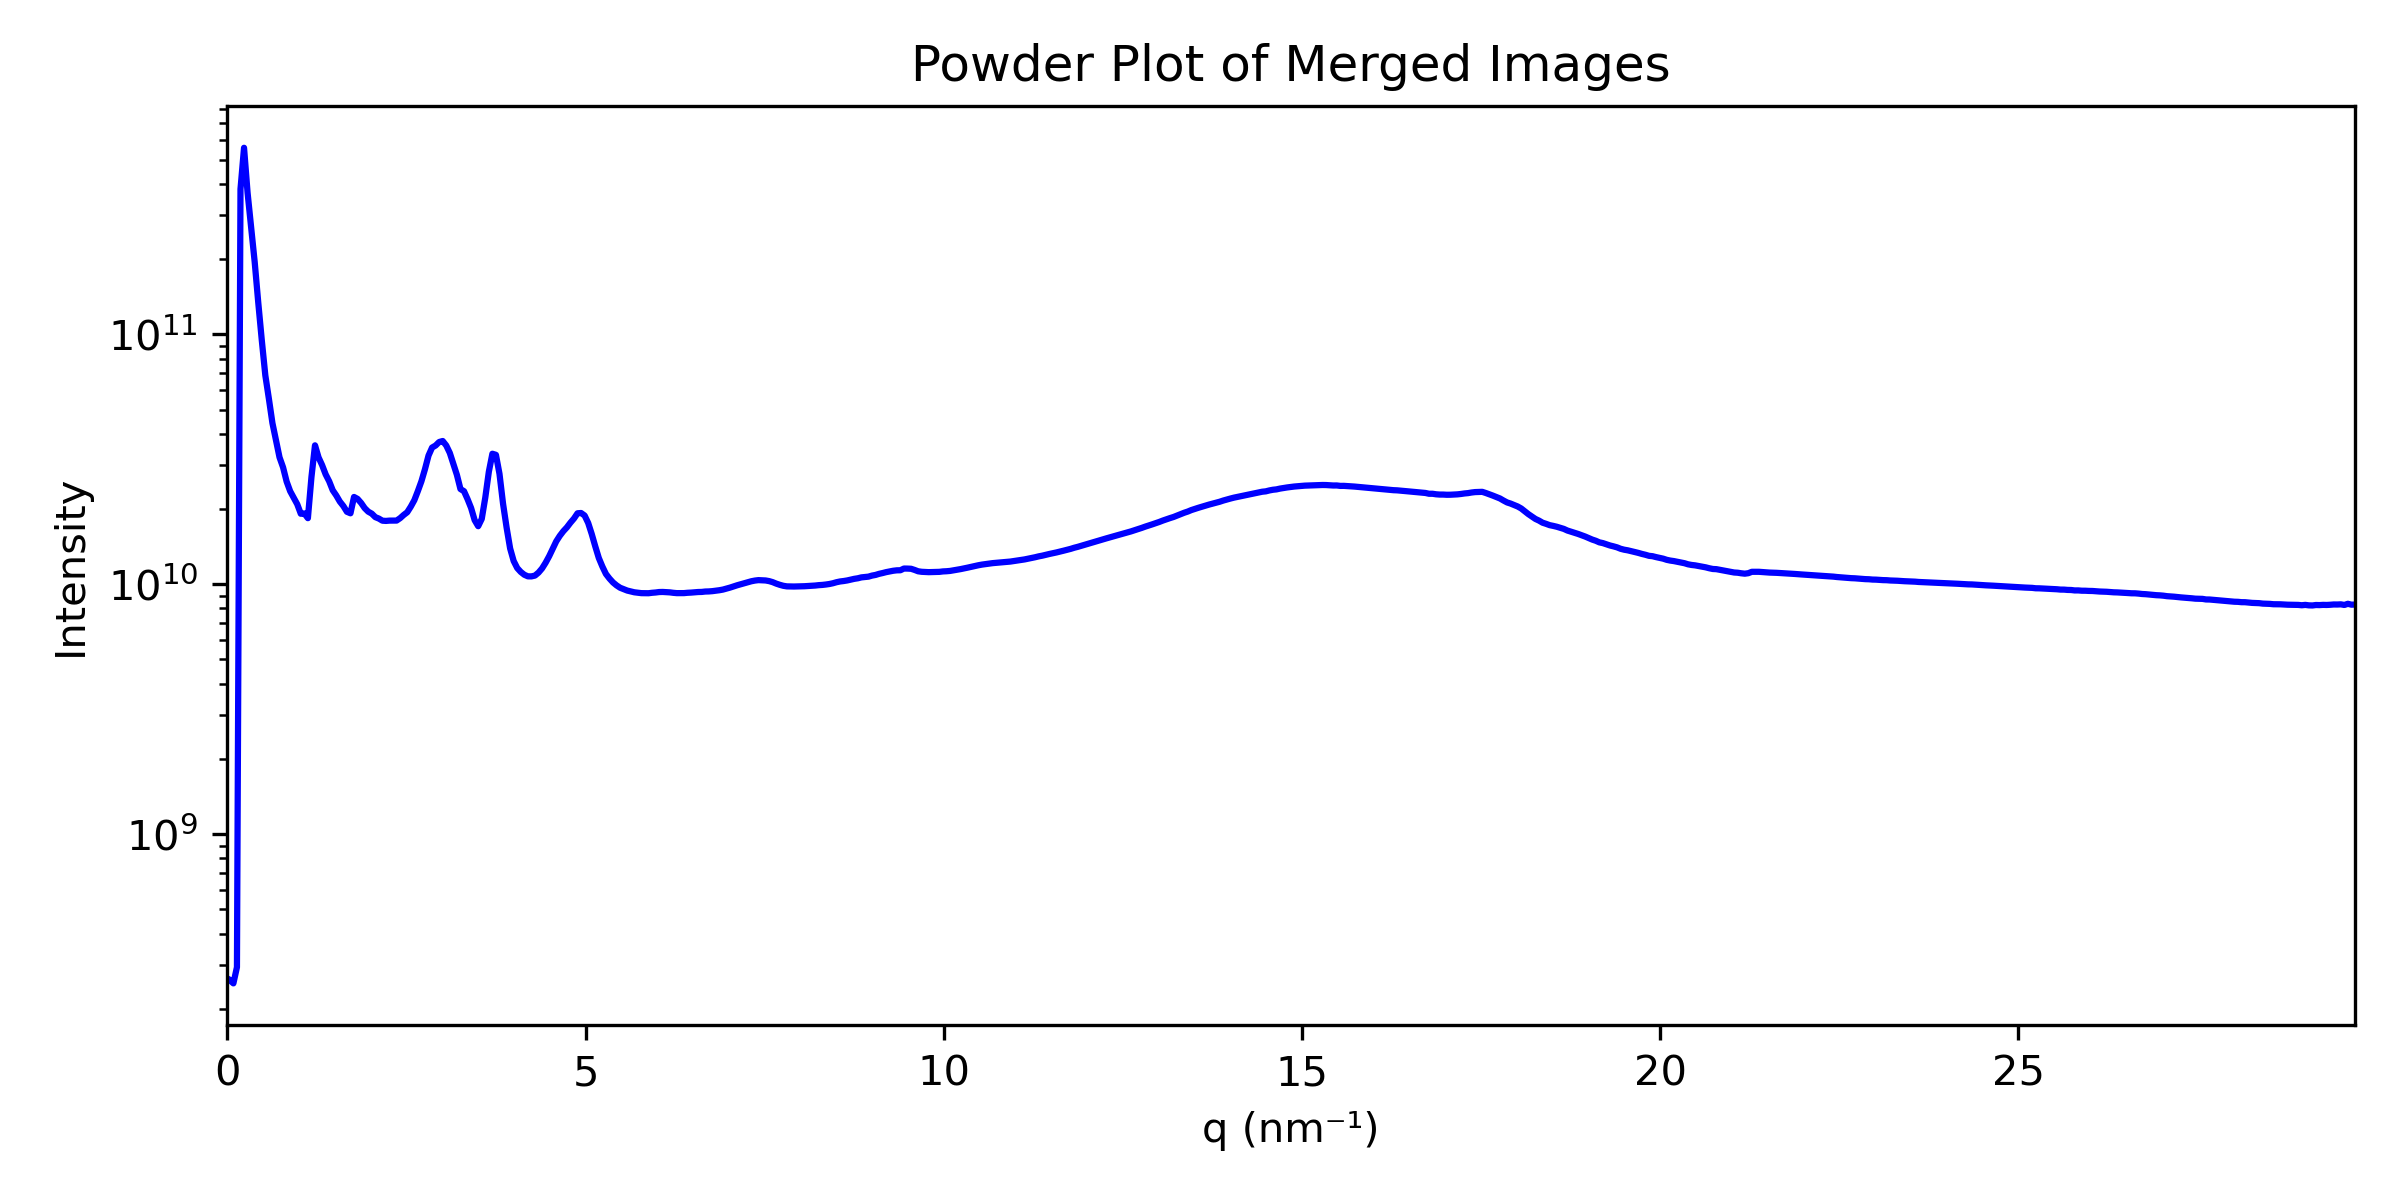
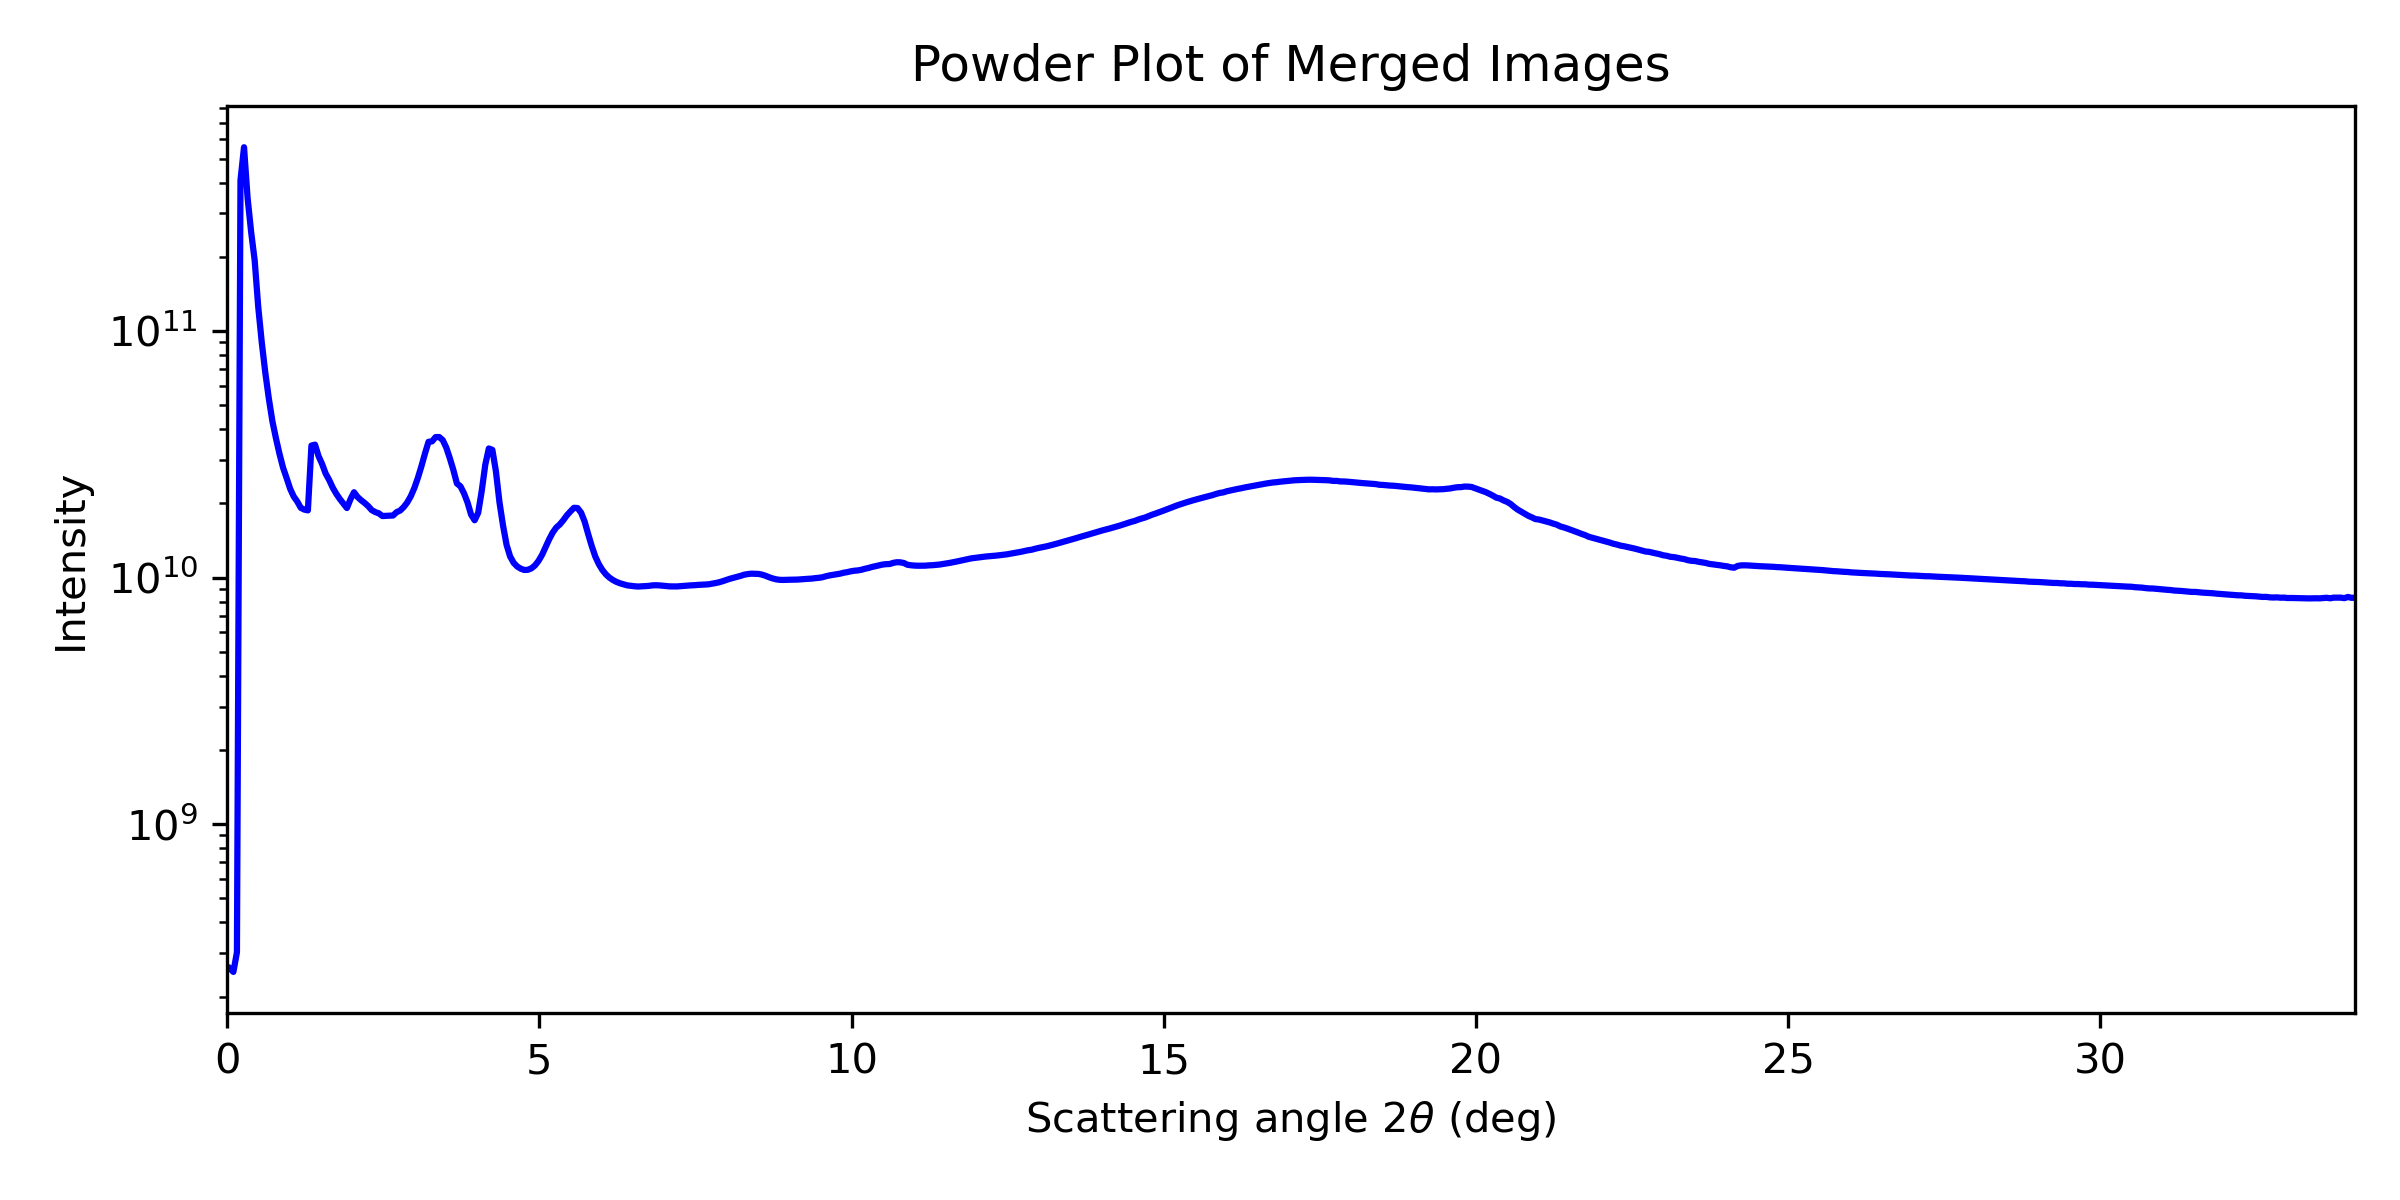
A powder plot represents the intensity as a function of the q vector, defined as \(q=\sqrt{q_{xy}^2+q_z^2}\). This allows for comparison with powder diffractograms obtained from other sources.
You can adjust the number of data points in the powder plot (which directly affects its resolution), then run the cell.
# Modify only the number of data points you want in the powder plots, and run the cell
npt_powder_plot = 600

...
Running the cell will generate the powder plot in q-space as well as in 2\(\theta\).
Additionally, dat files containing the corresponding data for further analysis will be generated.
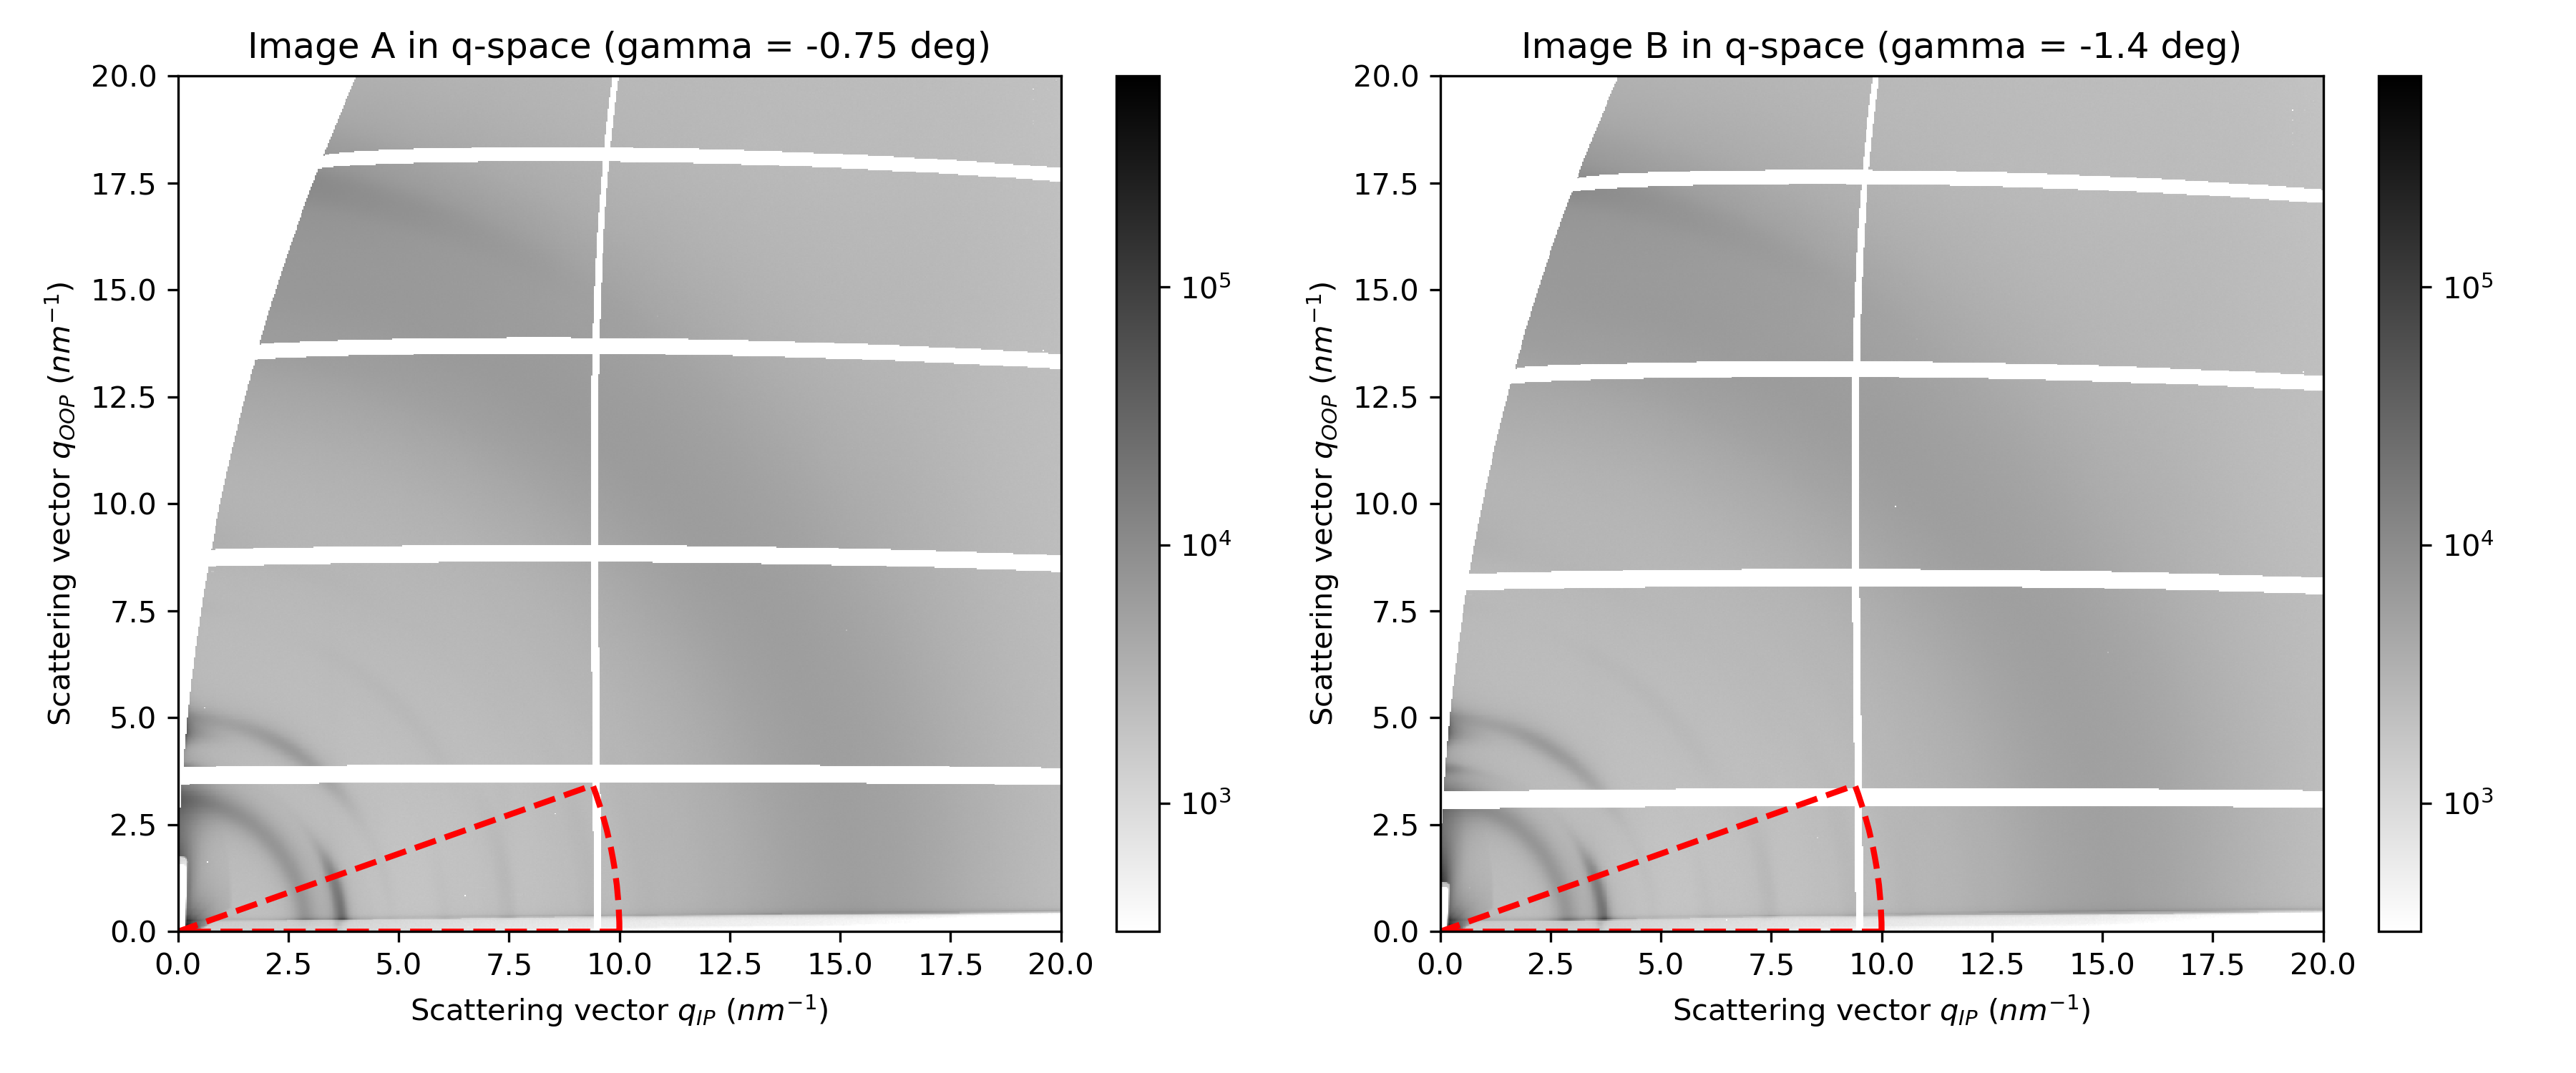
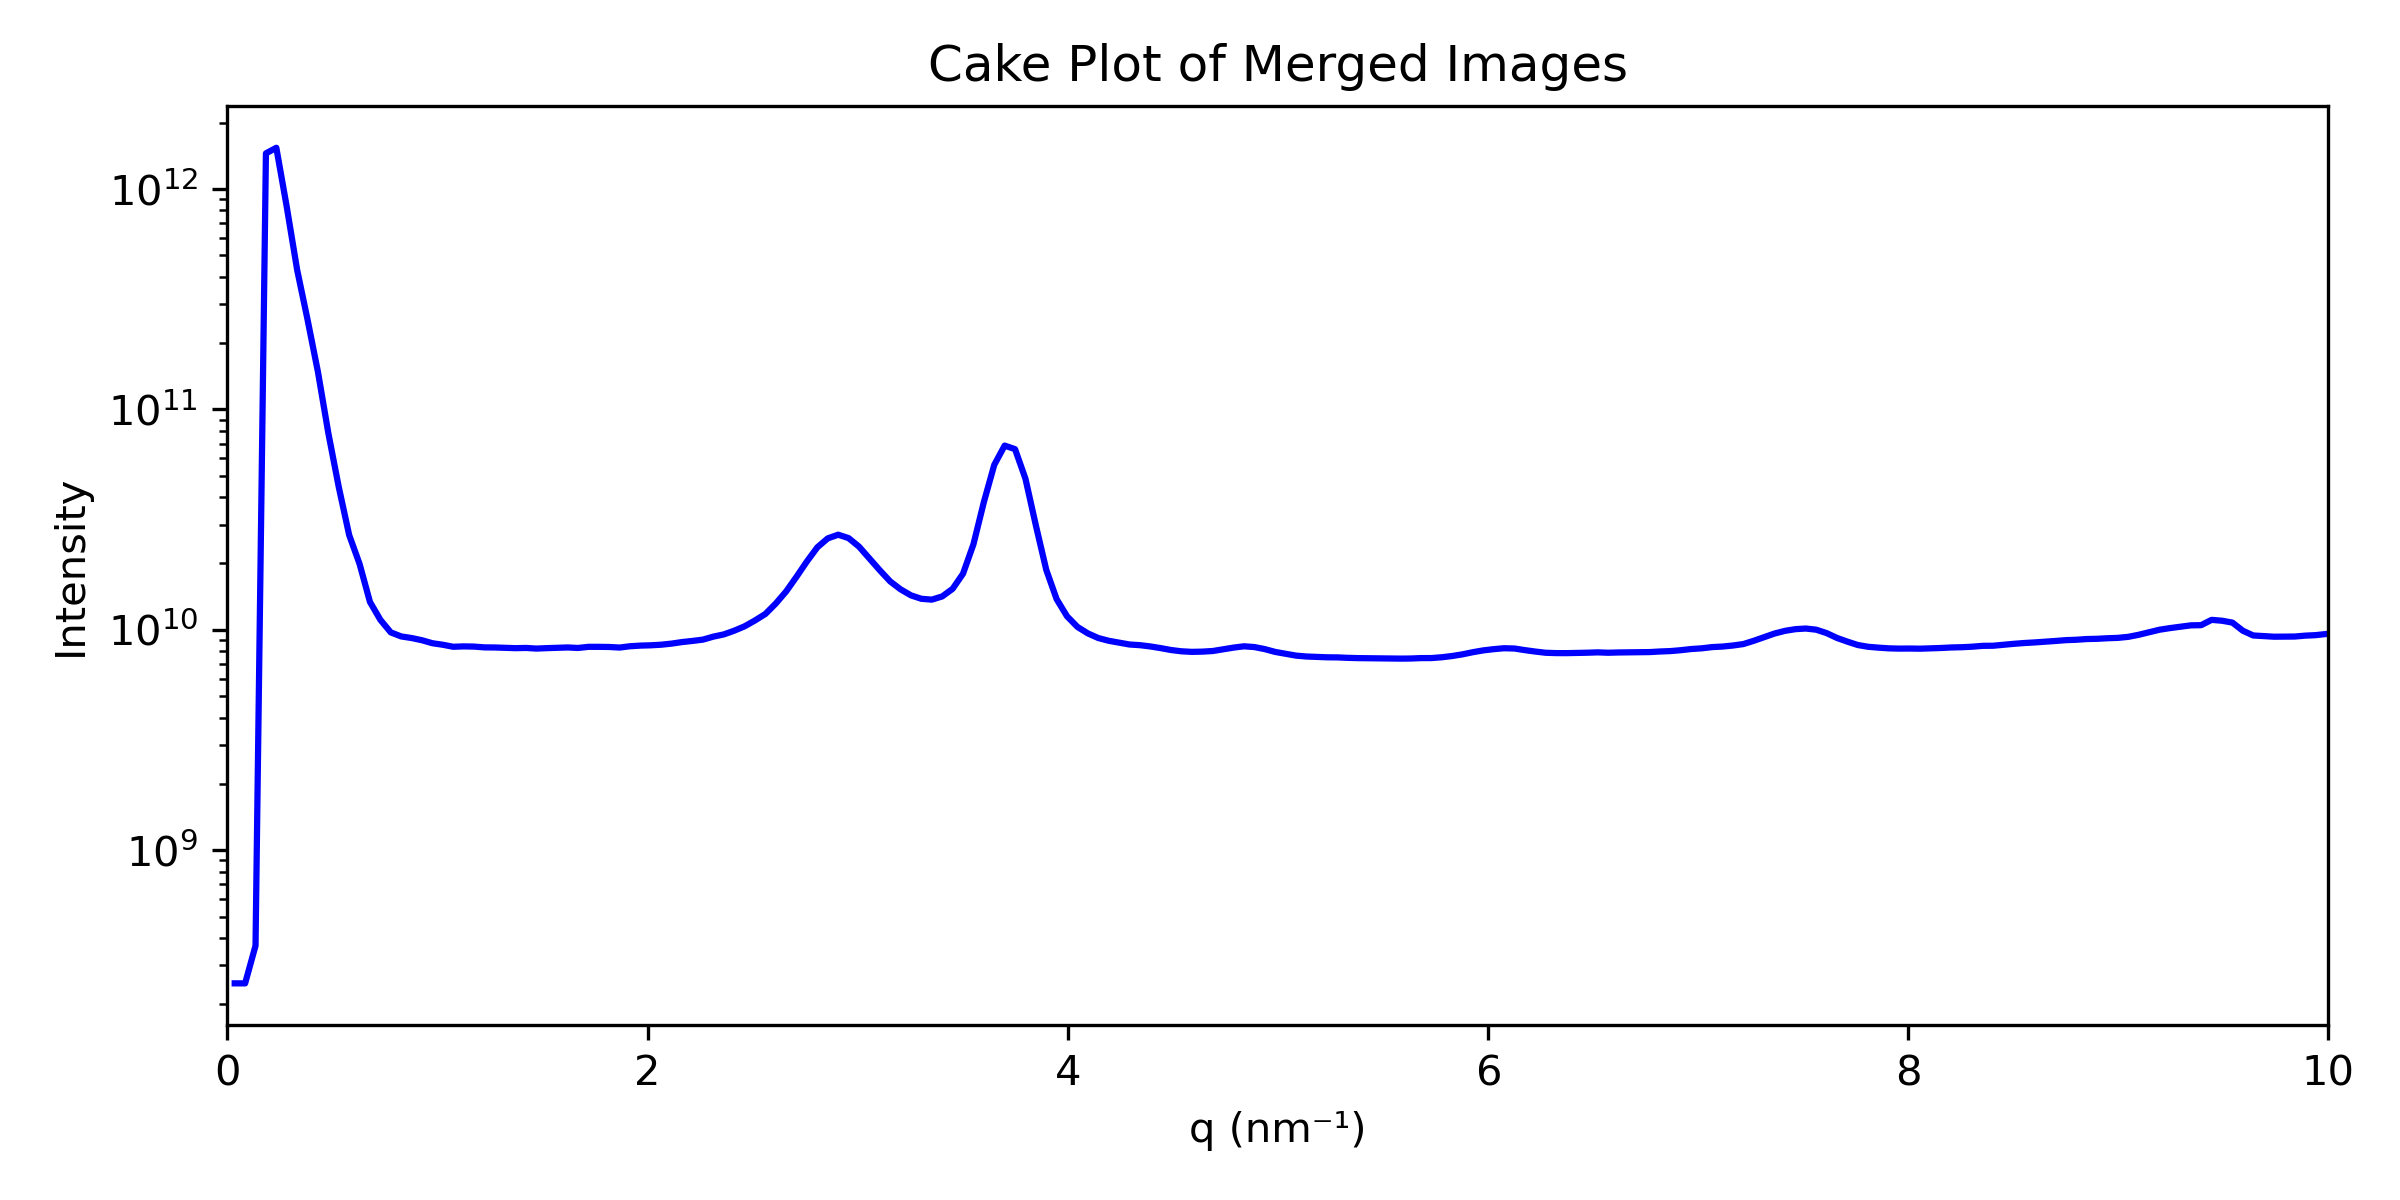
It is sometimes more interesting to focus only on a wedge for the integration, and not on the whole image. This integration is often called a “cake” or “sector” plot.
You can adjust the number of data points, the azimuthal range, the maximal q range on which you wish to integrate, and then run the cell.
# Modify only the number of data points you want in the cake plots,
# the azimuth range, the radius in q, and run the cell
npt_cake_plot = 600
azimuth_range = (-180,-160) # in deg
q_radius = 10 # in nm-1

...